
Figures & data
Figure 1. AT1R expression is elevated in the brain in db/db mice. (a) Quantification of AT1R mRNA in control and db/db mice; (b). Representative bands and quantification of AT1R protein in control and db/db mice(***, P < 0.005 vs. vehicle, N = 8)
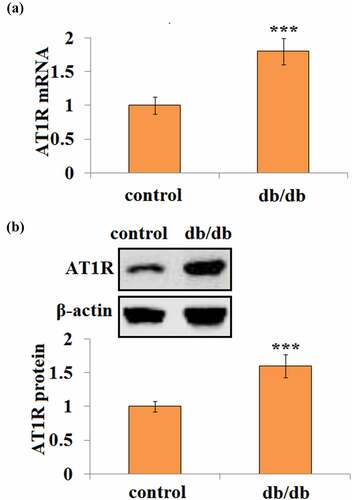
Figure 2. AT1R antagonist Valsartan attenuates diabetes-associated impairment of BBB integrity. (a). Molecular structure of Valsartan; (b). BBB permeability was measured using sodium fluorescein (NaFl)/fluorescein isothiocyanate (FITC)-Dextran permeability assay.(****, P < 0.001 vs. control, ###, P < 0.005 vs. db/db mice, N = 8)
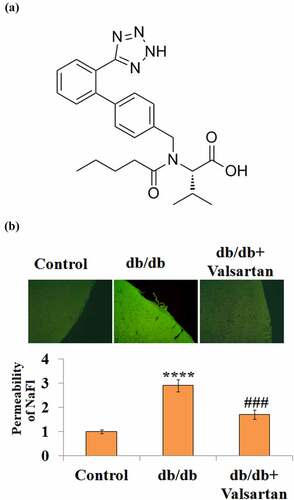
Figure 3. Valsartan restored the expression of VE-cadherin and claudin 2 in the brain of db/db mice. (a). Quantification of VE-cadherin and claudin 2 mRNA; (b). Fluorescent images of VE-cadherin and claudin 2 staining.(****, P < 0.001 vs. control, ###, P < 0.005 vs. db/db mice, N = 8)
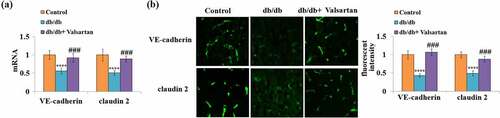
Figure 4. Valsartan suppressed pro-inflammatory mediators expression in high glucose (HG)-challenged human brain microvascular endothelial cells (HBMVECs). HBMVECs were incubated with 30 mM glucose or Valsartan (5 μM). (a). mRNA of IL-6; (b). mRNA of MCP-1; (c). IL-6 secretion; (d). MCP-1 secretion(****, P < 0.001 vs. control, ###, P < 0.005 vs. OGD/R, N = 5)
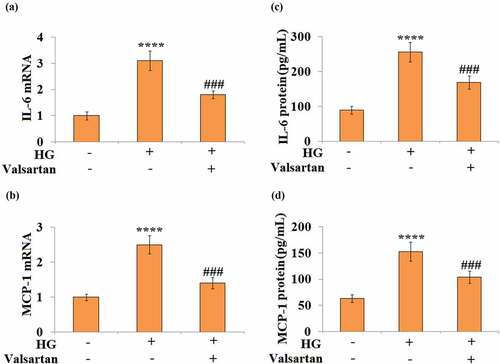
Figure 5. Valsartan ameliorated HG-induced enlargement of endothelial monolayer permeability in HBMVECs. HBMVECs were incubated with 30 mM glucose or Valsartan (5 μM). (a). Endothelial permeability; (b). The trans-endothelial electrical resistance (TEER).(****, P < 0.001 vs. control, ###, P < 0.005 vs. OGD/R, N = 5)
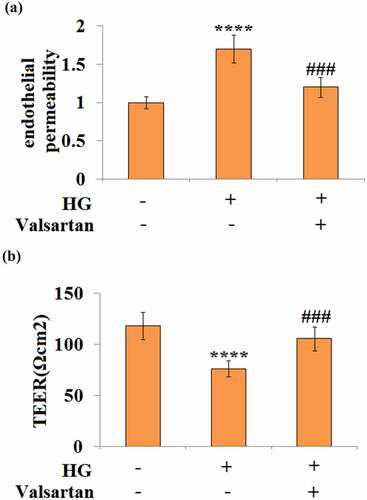
Figure 6. Valsartan restored VE-cadherin and claudin 2 expressions in HG-challenged HBMVECs. (a). VE-cadherin and claudin 2 mRNA expression; (b). VE-cadherin and claudin 2 protein expression as measured by western blot.(****, P < 0.001 vs. control, ###, P < 0.005 vs. OGD/R, N = 5–6)
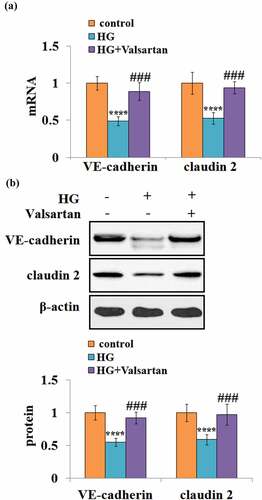
Figure 7. Valsartan ameliorated CREB inactivation in HG-challenged HBMVECs. (a). Cells were stimulated with HG for 1 and 2 hours. Phosphorylated (Ser 133) and total CREB were measured; (b). Cells were challenged with HG with or without Valsartan. Phosphorylated (Ser 133) and total CREB were measured. (****, P < 0.001 vs. control, ###, P < 0.005 vs. OGD/R, N = 5)
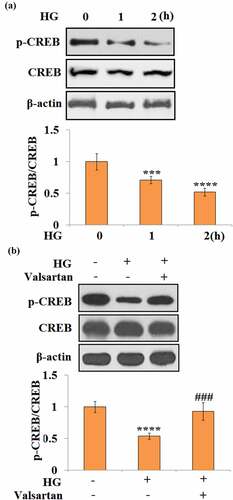
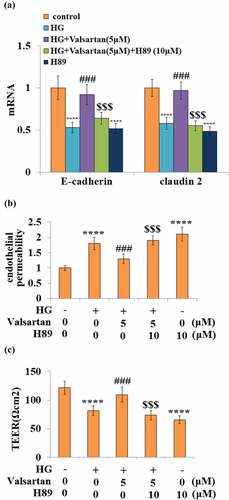
Figure 8. Blockage of CREB abolished the protective effects of Valsartan against HG-induced endothelial permeability and tight junction expression. Cells were treated with HG in the presence of Valsartan (5 μM) or H89 (10 μM) for 24 hours. (a). mRNA of E-cadherin and claudin 2; (b). Endothelial permeability; (B). The trans-endothelial electrical resistance (TEER) (****, P < 0.001 vs. control, ###, P < 0.005 vs. OGD/R; $$$, P < 0.005 vs. OGD/R+ Valsartan, N = 5)
Availability of data and materials
Data are available upon reasonable request from the corresponding author.