Figures & data
Figure 1. Schematic illustration of electro-spinning process
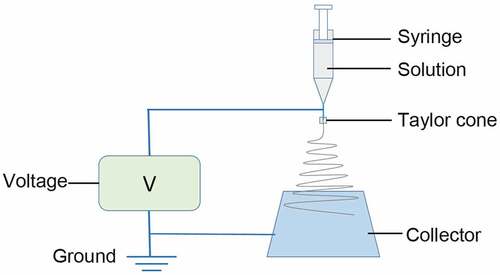
Figure 2. Protein production. (a) Schematic structure of SUMO-GMCDRSSP-IGF-1 spidroin. (b) The identification of the protein production. Lanes 1–9 are protein ladder, total protein before induction, total protein after induction, supernatant of cell lysate, precipitation of cell lysate, elution solution, mixture after ULP1 protease cleavage, GMCDRSSP-IGF-1 spidroin, and SUMO protein, respectively
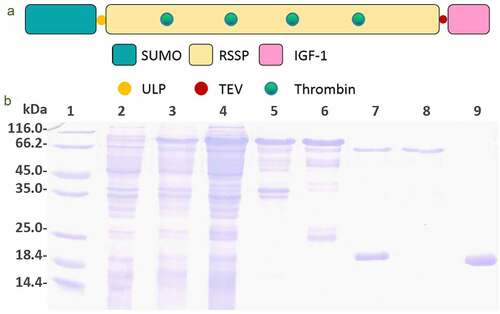
Figure 3. SEM images of nanofibrous membrane and diameter distribution histogram
Figure 4. Characteristics of the nanofibrous membrane. (a) CD spectra. (b) WAXD pattern. (c) FITR spectra. (d) Typical stress-strain curve. (e) TG and DTG curves. (f) Water contact angle (up) and hemolysis assays (bottom). (+), (-) and (m) represent positive controls, negative controls, and nanofibrous membrane
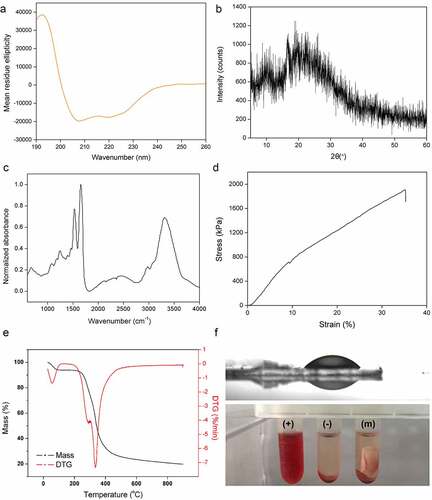
Figure 5. Degradation testing results of GMCDRSSP-IGF-1 spidroins in vitro. SEM images of degraded nanofibrous membrane (Left) and degradation curve (Right)
Figure 6. Controlled sustained-release performance test in vitro of GMCDRSSP-IGF1 spidroins
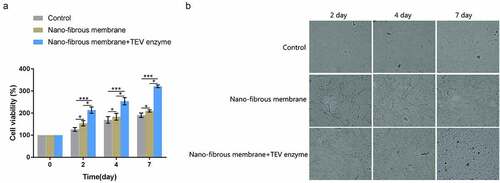
Figure 7. Effects on the proliferation of EPCs cultured on GMCDRSSP-IGF-1 nanofibrous membrane in vitro.