
Figures & data
Table 1. The correlation between the lncRNA DARS-AS1 expression level and the Pathological factors of HCC patients
Figure 1. DARS-AS1 expression in HCC tissues and cells and its correlation with HCC prognosis
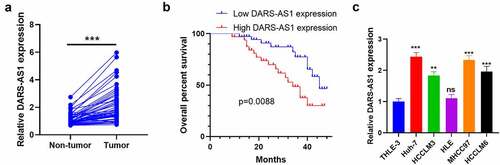
Figure 2. DARS-AS1 subserved HCC proliferation, invasion and EMT
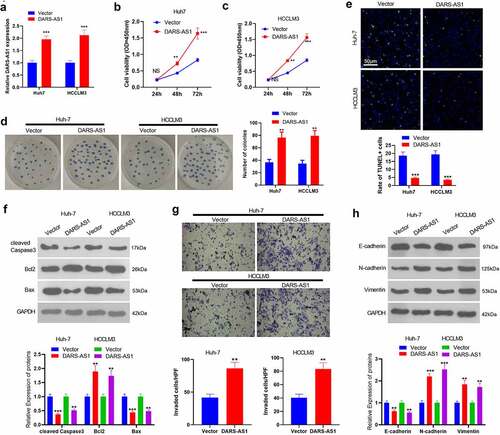
Figure 3. DARS-AS1 overexpression accelerated the growth and metastasis of HCC cells
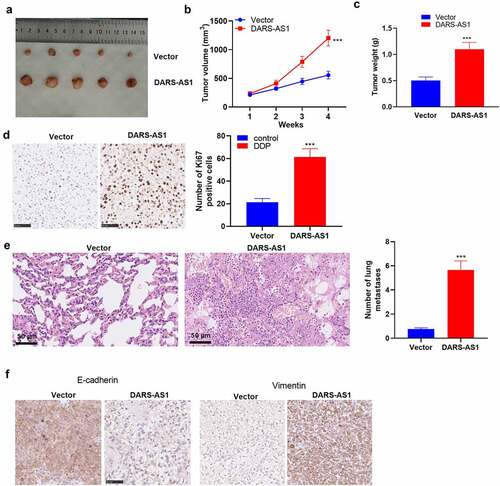
Figure 4. DARS-AS1 promoted the CKAP2 expression
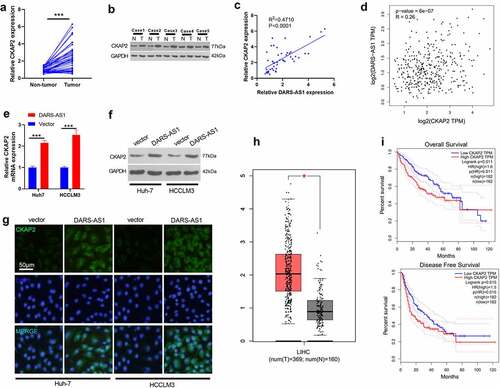
Figure 5. Overexpressing CKAP2 heightened the proliferation, invasion and EMT of HCC cells
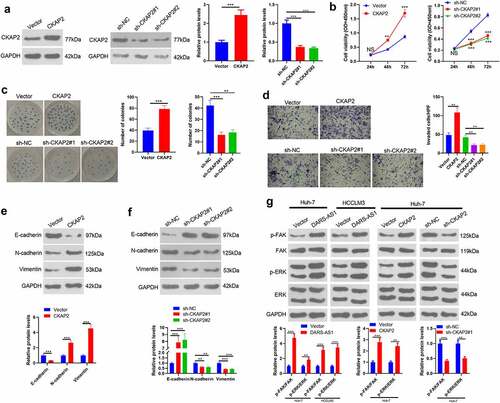
Figure 6. DARS-AS1 targeted miR-3200-5p, and the latter targeted CKAP2
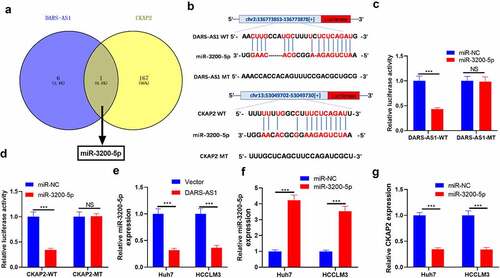
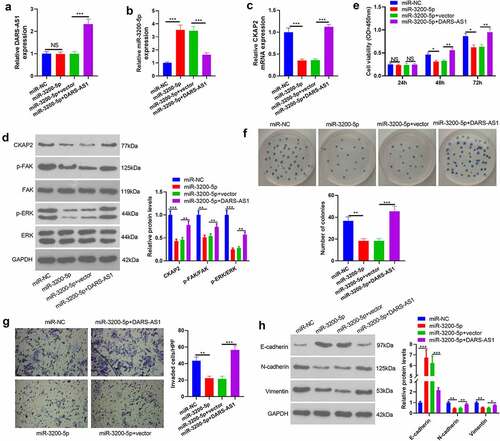
Figure 7. DARS-AS1 weakened the tumor-suppressive effect mediated by miR-3200-5p overexpression
Availability of data and material
The data sets used and analyzed during the current study are available from the corresponding author on reasonable request.