
Figures & data
Table 1. Baseline characteristics of participants included in this study
Figure 1. Percentage of gut microbiota on phylum level (a) and genus level (b)
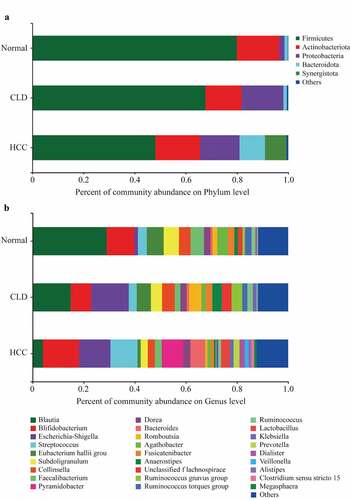
Figure 2. Principal co-ordinates analysis (PCoA) of gut microbiota among healthy individuals, CLD and HCC patients
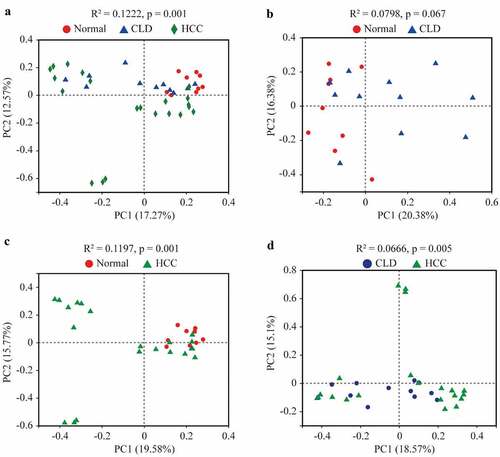
Figure 3. Proportion comparisons of gut microbiota between healthy individuals and CLD patients (a), healthy individuals and HCC patients (b), and CLD and HCC patients (c) on phylum level
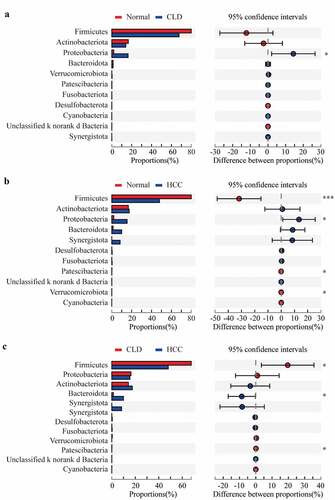
Figure 4. Proportion comparisons of gut microbiota between healthy individuals and CLD patients (a), healthy individuals and HCC patients (b), and CLD and HCC patients (c) on genus level
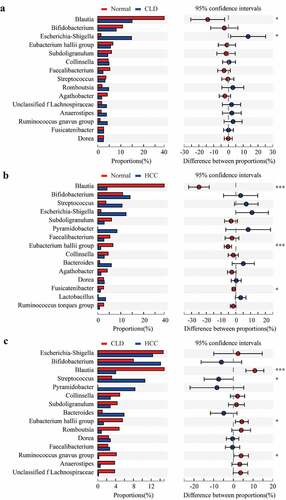
Figure 5. Spearman correlations between gut microbiota and clinical biochemical parameters on phylum level
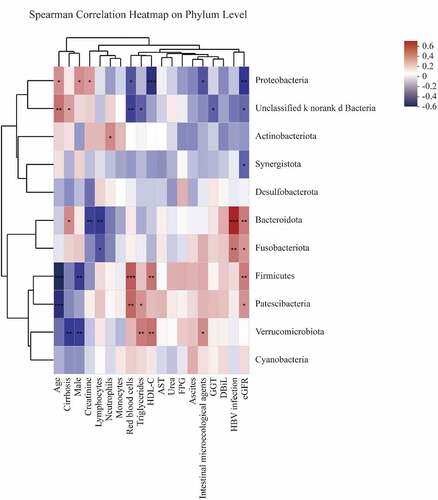
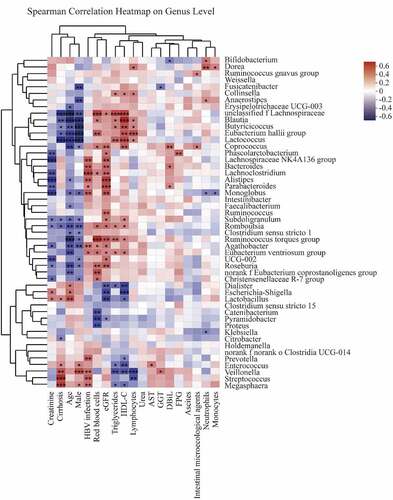
Figure 6. Spearman correlations between gut microbiota and clinical biochemical parameters on genus level
Supplemental Material
Download ()Data availability
All the datasets were available from the corresponding author (Z. Yang) with reasonable request.