Figures & data
Table 1. List of specific primer pairs for target and reference genes for RT-qPCR analysis
Figure 1. The expression of LETM1 in ESCC cells. (a) The mRNA expression of LETM1 in ESCC cells; (b) The protein expression of LETM1 in ESCC cells. ***P < 0.001 vs. Het-1A
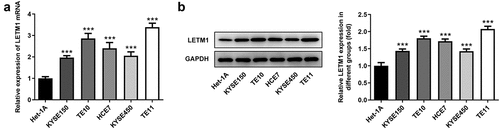
Figure 2. The results of cell proliferation, invasion and migration in ESCC. (a) The mRNA expression of LETM1 in transfected cells; (b) The protein expression of LETM1 in transfected cells; (c) The result of ESCC cell proliferation; (d) The result of wound healing assay in ESCC cells; (e) The result of transwell assay in ESCC cells; (f) The results of cell invasion and migration-related protein expression. **P < 0.01, ***P < 0.001 vs. siRNA-NC
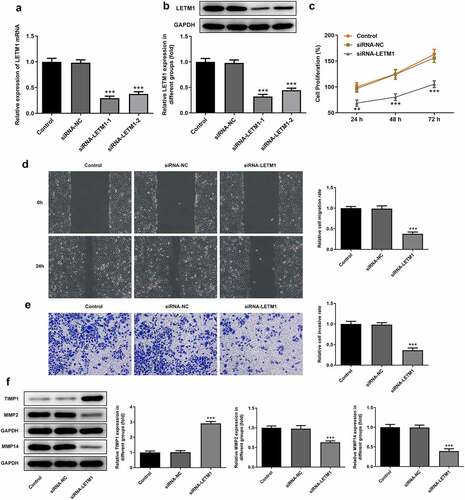
Figure 3. The results of angiogenesis in ESCC. (a) The pictures of tube formation; (b) The related protein expression of tube formation. ***P < 0.001 vs. siRNA-NC
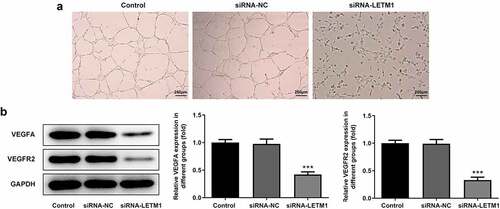
Figure 4. LETM1 in conjunction with KIF14 in ESCC cells. The (a) mRNA and (b) protein expression of KIF14 in ESCC cells, ***P < 0.001 vs. Het-1A; (c-d) The results of CoIP assay; The (e) mRNA and (f) protein expression of KIF14 in transfected cells, ***P < 0.001 vs. siRNA-NC
Figure 5. The results of cell proliferation, invasion and migration in ESCC affected by LETM1 and KIF14. The (a) mRNA and (b) protein expression of KIF14 in transfected cells, *P < 0.05, ***P < 0.001 vs. Ov-NC; (c) The result of ESCC cell proliferation; (d) The result of wound healing assay in ESCC cells; (e) The result of transwell assay in ESCC cells; (f) The results of cell invasion and migration-related protein expression. ***P < 0.001 vs. control; ##P < 0.01, ###P < 0.001 vs. siRNA-LETM1+ Ov-NC
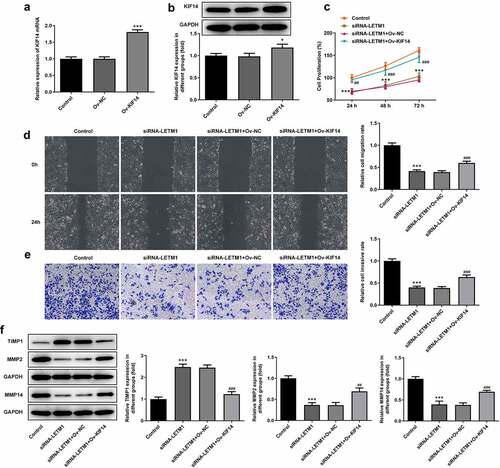
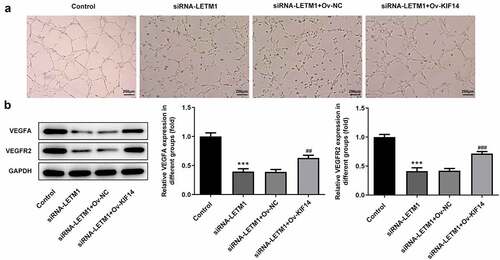
Figure 6. The results of angiogenesis in ESCC effected by LETM1 and KIF14. (a) The pictures of tube formation; (b) The related protein expression of tube formation. ***P < 0.001 vs. control; ##P < 0.01, ###P < 0.001 vs. siRNA-LETM1+ Ov-NC