Figures & data
Table 1. The correlation between SPNS3 expression and clinical phenotypes in the WGCNA co-expression network
Figure 1. SPNS3 high expressed in acute myeloid leukemia (AML). a. Pan-cancer analysis showed that the average SPNS3 expression was highest in AML; b. Compared to normal tissues, SPNS3 expression significantly increased in AML
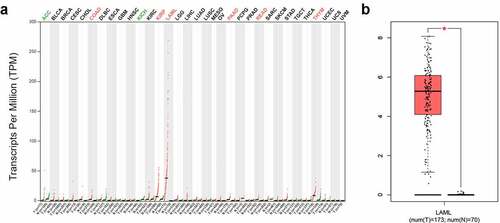
Figure 2. High SPNS3 expression significantly influenced the survival of AML patients. a, b. The Kaplan–Meier survival analyses to both the event-free survival and the overall survival of the AML patients for the SPNS3 expression in the TARGET database. c, d. The overall survival of the patients in the TCGA database and the GSE12417 dataset acquired from the prognoscan website analyzed by the Kaplan-Meier method to verify the effect of SPNS3 to the survival of AML patients
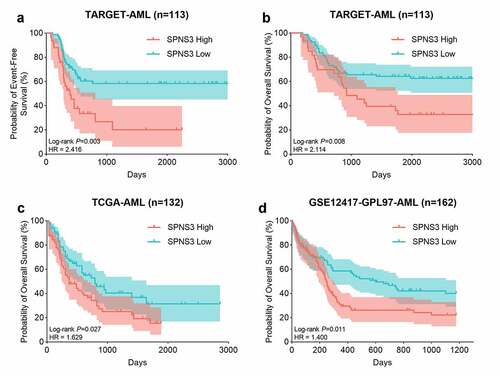
Figure 3. Gene enrichment analysis indicated a potential mechanism that correlated with high SPNS3 expression. Significantly (false discovery rate (FDR)<0.05) enriched GO terms (a) and KEGG pathways (b) of differentially expressed genes (DEGs) between the SPNS3-high and -low groups in the TARGET database
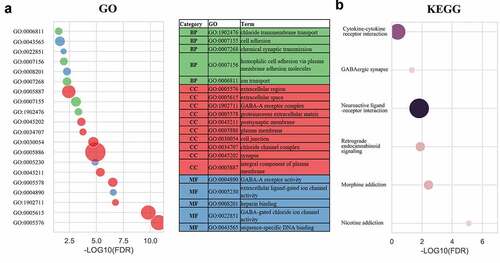
Figure 4. Identification of the ceRNA-axis regulation of SPNS3 expression. a, b. LncRNA AC127521.1 expression positively correlated with SPNS3 expression in AML samples from both the TCGA and the TARGET databases. c. Four potential lncRNA-miRNA-mRNA-ceRNA axes were predicted by merging the result from the TargetScan and DIANA databases. d, e. MIR-139 expression negatively correlated with both LncRNA AC127521.1 and SPNS3 expression in AML samples in the TARGET database. f. By comparing the AML samples of the SPNS3-high and SPNS3-low groups in the TARGET database, the AC127521.1/MIR-139/SPNS3 ceRNA axis was validated in terms of the RNA expression level, and the ceRNA relationship was more apparent in the SPNS3-high group. g. The alignment of the MIR-139 sequence with predicted binding sites in the regions of LncRNA AC127521.1 and mRNA SPNS3 is shown
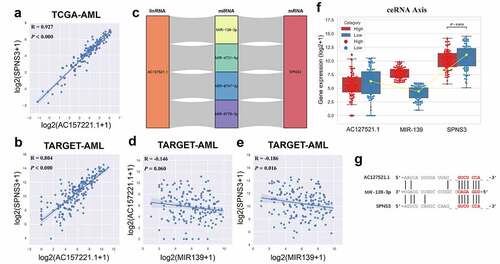
Table 2. Results of statistical analysis of the three microarray databases derived from the GEO database
Figure 5. Identification of the FLT3-ITD mutation as an important regulator of SPNS3 expression. a. 582 upregulated genes (adj.P-val<0.05) in FLT3-ITD-positive AML were selected after the venn analysis of three GEO datasets (GSE14468, GSE17855, and GSE52891). b. Log2 value of the fold-change in SPNS3 expression indicated a consistently high expression of SPNS3 in FL3-ITD-positive AML in the above mentioned three datasets. c. Analysis of gene expression in the TARGET database showed that SPNS3 expression was significantly high in FLT3-ITD-positive AML samples whereas there was no apparent intergroup difference in SPNS2 expression. D. The AML samples with high SPNS3 expression in the TARGET database tended to be enriched with FLT3-ITD mutations on the GSEA
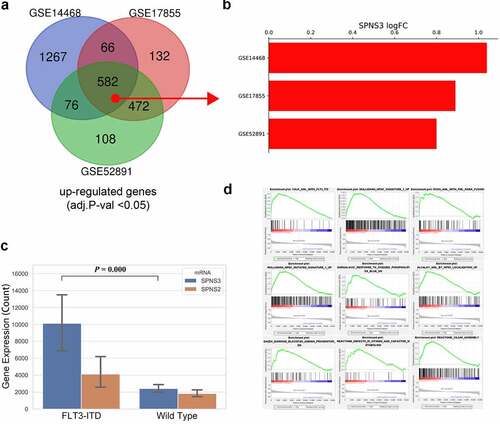
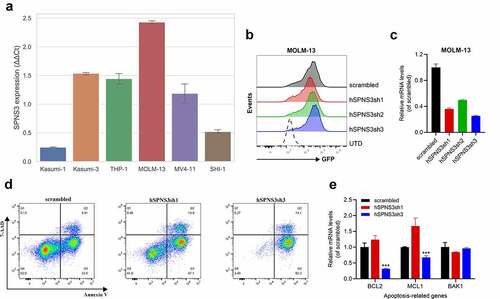
Figure 6. High SPNS3 expression induced apoptosis resistance in AML. a. qRT-PCR in six variant AML cell lines showed the highest SPNS3 expression in the FLT3-ITD+ cell line MOLM-13. b. The transfection efficiency was measured by using green fluorescent protein (GFP). The ratio of GFP+ cells of the four groups of the transfected MOLM-13, namely scrambled, hSPNS3sh1, hSPNS3sh2, and hSPNS3sh3, were similar and all higher than 90%. c. SPNS3 expression decreased in SPNS3 knocked-down MOLM-13 cells compared to the scrambled control. SPNS3 expression decreased more than 60% in hSPNS3sh1- and hSPNS3sh3- transfected MOLM-13 cells. d. Compared to the scrambled control, knocking down SPNS3 induced significant apoptosis in MOLM-13 cells. e. Relative quantitative expression of anti-apoptotic and pro-apoptotic genes