Figures & data
Figure 1. Score plots of three different analyses based on ESI+ mode in PCOS and POF. (a) Principal component analysis (PCA), (b,c) Partial least discriminant analysis (PLS-DA) (d) Orthogonal partial least square discriminant analysis (OPLS-DA) was used for displaying PCOS and POF subjects
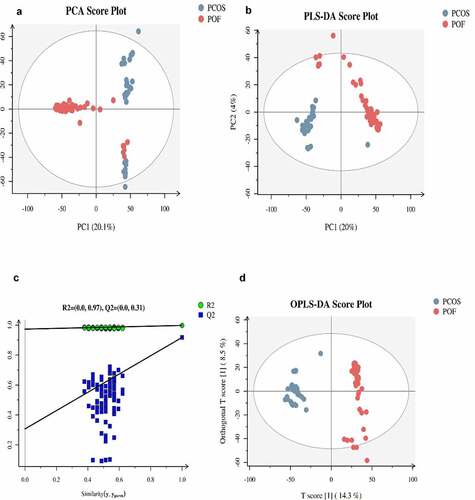
Figure 2. The identification of total DEMs in between three groups. Bar plots represent the total expressed DEMs in between ESI+ (a) ESI− (b) modes
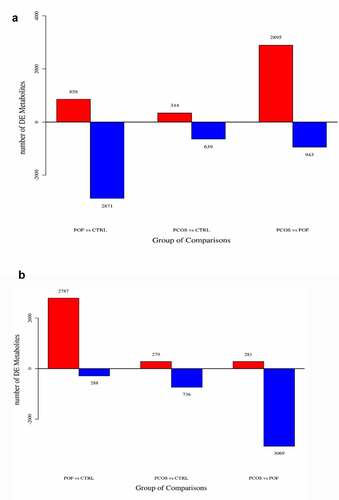
Table 1. Top-ranked DEMs discovered by metabolomics in between three groups
Table 2. Top-ranked KEGG pathways obtained related to DEMs metabolites in between three groups
Figure 3. The significant DEMs were discovered and verified in PCOS vs CTRL group. (a) Heatmap clustering represented the significant DEMs. (b) Z score statistical analysis was done for obtaining high-rank DEMs. (c) Pearson correlation coefficient analysis was performed between each DEM. (d) KEGG pathways related to metabolites were presented via bubble plot. Bigger the bubble, higher the involved significant metabolites
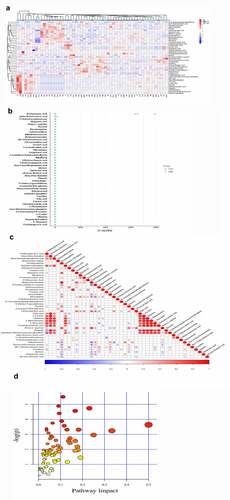
Figure 4. The significant DEMs were discovered and verified similarly in POF vs CTRL group. (a) Heatmap clustering showed significant DEMs. (b) Z score statistical analysis was performed for obtaining high-rank DEMs. (c) Pearson correlation coefficient analysis was done between each DEM. (d) KEGG pathways related to metabolites were represented via bubble plot
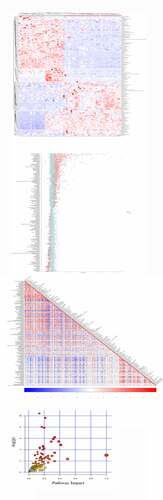
Figure 5. The significant DEMs were determined in POF vs CTRL group. (a) Heatmap clustering demonstrated the significant DEMs. (b) Z score statistical analysis was carried out for obtaining high-rank DEMs. (c) Pearson correlation coefficient analysis was performed between each DEM. (d) KEGG pathways related to metabolites were mentioned via bubble plot
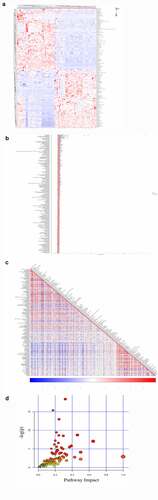
Figure 6. Discovery and significance of most common metabolites in between three groups. (a) Venn diagram demonstrated total and most commonly expressed DEMs in between comparison of three groups. (b,c) In PCOS vs POF group, Monomethyl sulfate and Riboflavin were highly expressed in PCOS compared to POF and represented good diagnostic efficiency by ROC-AUC (P < 0.05)
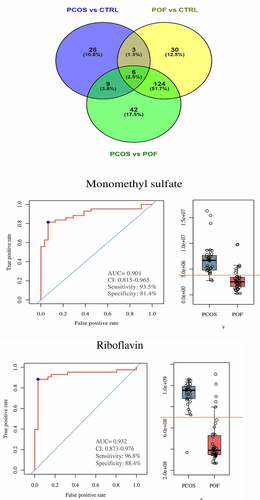
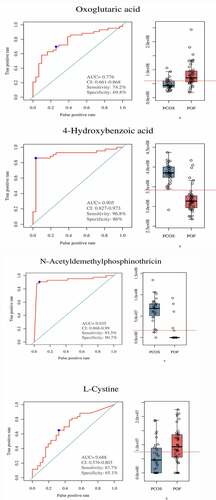
Figure 7. Significance of metabolites in between PCOS and POF groups. ROC curves and Bar plots showed clinical significance and expression of metabolites in a particular group. (a) Oxoglutaric acid, (b) 4-hydroxybenzoic acid, (c) N-Acetyldemethylphosphinothricin, (d) L-Cystine. They demonstrated promising diagnostic efficiency (P < 0.05)