Figures & data
Figure 1. The effect of silenced TTN-AS1 on OSCC cells (a) The expression of TTN-AS1 in normal tissues and tumor tissues. Tumor, OSCC tissues. Normal, adjacent normal tissues. **P < 0.001. (b) The expression of TTN-AS1 in human oral epithelial cells (HOEC) and OSCC cells (SCC-4, CAL-27 and HSC-3). **P < 0.001 vs. HOEC. (c) The transfection efficiency of two siRNAs targeting TTN-AS1 in SCC-4 and HSC-3 cells. (d) Cell proliferation was detected using CCK8 assay in SCC-4 and HSC-3 cells transfected with si-lnc1 and si-lnc2. (e) Cell apoptosis was detected using flow cytometry in SCC-4 and HSC-3 cells transfected with si-lnc1 and si-lnc2. (f) The cell adhesion was detected using cell adhesion assay in SCC-4 and HSC-3 cells transfected with si-lnc1 and si-lnc2. (g) The migration rate was detected using wound healing assay in SCC-4 and HSC-3 cells transfected with si-lnc1 and si-lnc2. (c-g) si-lnc1 and si-lnc2 are two siRNAs of TTN-AS1. NC, negative control. **P < 0.001 vs. si-NC
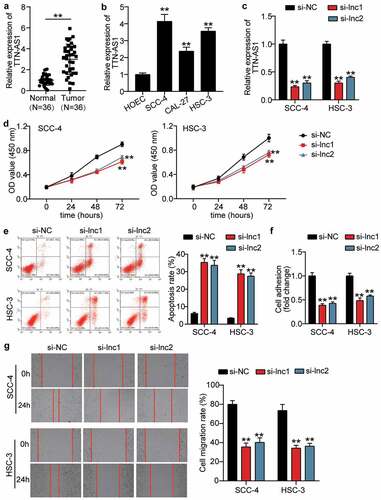
Figure 2. The identification of key gene and miRNAs in OSCC (a) The DEGs in OSCC samples were screened from GSE37991. (b) Metascape was used to enrich the key biological processes for the screened genes. (c) The four genes (RUNX1, PDGFB, FN1 and VEGFA) were the common genes of three biological processes. (d) The correlation between RUNX1 and TTN-AS1 in head and neck squamous cell carcinoma samples according to GEPIA data. (e) he correlation between PDGFB and TTN-AS1 in head and neck squamous cell carcinoma samples according to GEPIA data. (f) The correlation between FN1 and TTN-AS1 in head and neck squamous cell carcinoma samples according to GEPIA data. (g) The correlation between VEGFA and TTN-AS1 in head and neck squamous cell carcinoma samples according to GEPIA data. (h) Five miRNAs were the common miRNAs of miRDB, TargetScan, TarBase and starBase. miRDB, TargetScan and TarBase were three databases to predict the miRNAs targeting RUNX1. starBase was a database to predict the miRNAs sponged by TTN-AS1
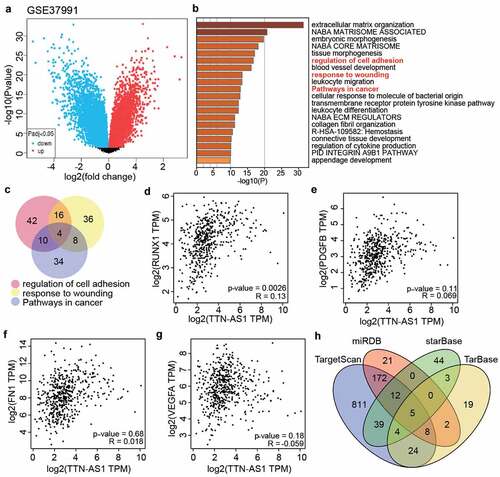
Figure 3. miR-199a-3p could be sponged by TTN-AS1 (a-e) The expression levels of miR-200a-3p (a), miR-199a-3p (b), miR-199b-3p (c), miR-27a-3p (d), and miR-27b-3p (e) in normal tissues and tumor tissues. Tumor, OSCC tissues. Normal, adjacent normal tissues. ns, No significant. *P < 0.05, **P < 0.001. (f) The correlation between miR-199a-3p expression and TTN-AS1 expression in OSCC tissues. (g) The binding sites between TTN-AS1 and miR-199a-3p was predicted by starBase. (h) The transfection efficiency of miR-199a-3p mimic in SCC-4 and HSC-3 cells. mimic, miR-199a-3p mimic. NC, negative control. **P < 0.001. (i) The relationship between TTN-AS1 and miR-199a-3p was identified using luciferase assay. WT, wild-type. MUT, mutant. mimic, miR-199a-3p mimic. NC, negative control. **P < 0.001
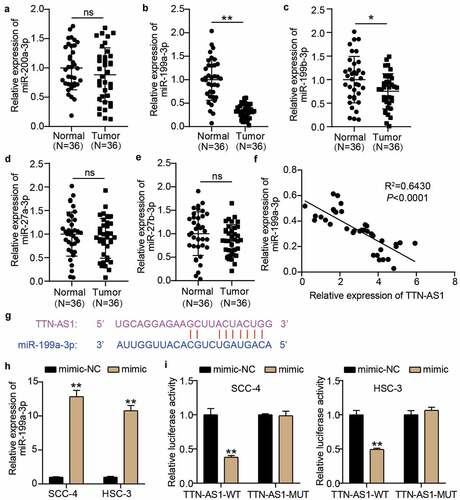
Figure 4. miR-199a-3p inhibitor partly relieved the effect of silenced TTN-AS1 on OSCC cells (a) miR-199a-3p inhibitor partly relieved the effect of silenced TTN-AS1 on cell proliferation. (b) miR-199a-3p inhibitor partly relieved the effect of silenced TTN-AS1 on cell apoptosis. (c) miR-199a-3p inhibitor partly relieved the effect of silenced TTN-AS1 on cell adhesion. (d) miR-199a-3p inhibitor partly relieved the effect of silenced TTN-AS1 on cell migration. si-lnc, si-TTN-AS1. inhibitor, miR-199a-3p inhibitor. NC, negative control. **P < 0.001 vs. si-NC. ##P < 0.001 vs. si-lnc+inhibitor
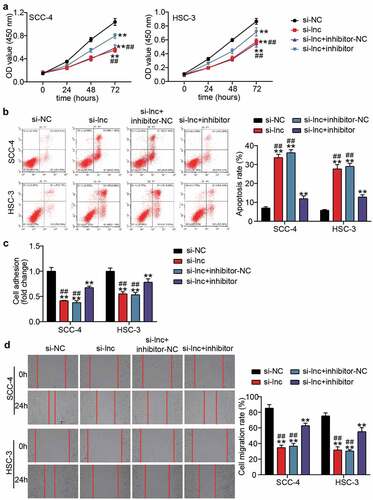
Figure 5. RUNX1 was a target of miR-199a-3p. (a) The binding sites between RUNX1 3ʹUTR and miR-199a-3p were predicted by TargetScan. (b) The relationship between RUNX1 and miR-199a-3p was detected by luciferase assay. WT, wild-type. MUT, mutant. mimic, miR-199a-3p mimic. NC, negative control. **P < 0.001. (c) The expression of RUNX1 in normal tissues and tumor tissues. Tumor, OSCC tissues. Normal, adjacent normal tissues. **P < 0.001. (d) The correlation between miR-199a-3p expression and TTN-AS1 expression in OSCC tissues
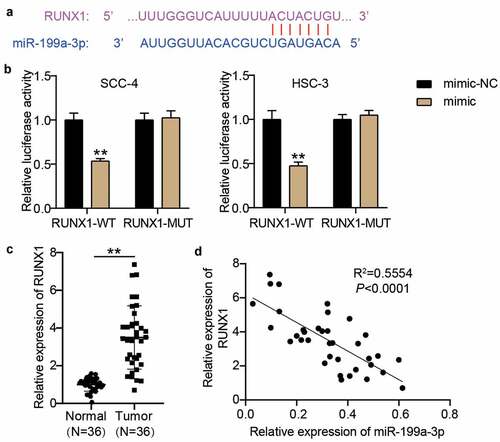
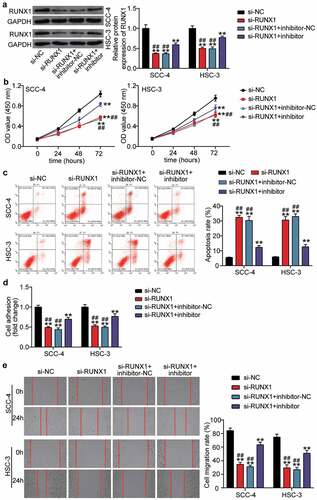
Figure 6. The negative effect of si-RUNX1 was partly relieved by miR-199a-3p inhibitor in OSCC cells (a) The expression of RUNX1 protein in SCC-4 and HSC-3 cells was detected by western blotting. (b) The negative effect of si-RUNX1 on cell proliferation was partly relieved by miR-199a-3p inhibitor. (c) The positive effect of si-RUNX1 on cell positive was partly relieved by miR-199a-3p inhibitor. (d) The negative effect of si-RUNX1 on cell adhesion was partly relieved by miR-199a-3p inhibitor. (e) The negative effect of si-RUNX1 on cell migration was partly relieved by miR-199a-3p inhibitor. inhibitor, miR-199a-3p inhibitor. NC, negative control. **P < 0.001 vs. si-NC. ##P < 0.001 vs. si-lnc+inhibitor