Figures & data
Table 1. Relationship between miR-196b expression and clinical parameters of patients with ESCC
Table 2. Multivariate Cox analysis of clinical characteristics in relation to overall survival
Figure 1. miR-196b expression was measured in ESCC tissue and cells. A. miR-196b expression was increased in ESCC tissue samples compared to adjacent normal tissue specimens. the analysis was carried out using paired students’ t-test by graphpad prism software. B. miR-196b expression was raised in four ESCC cell lines than normal esophageal epithelial cell Het-1A. the data were analyzed using one-way ANOVA by graphpad prism software. ***P < 0.001
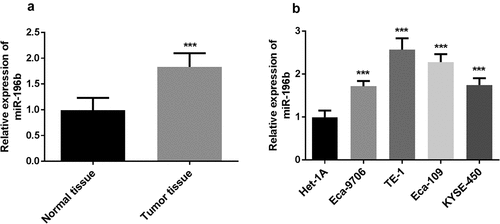
Figure 2. Kaplan-meier method was conducted to analyze the five-year survival rate of ESCC patients using SPSS software. high expression of the miR-196b group displayed a shorter overall survival rate than the low miR-196b expression group (log-rank test P= 0.005)
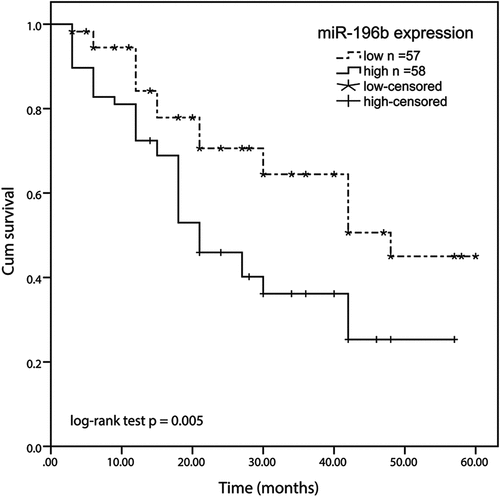
Figure 3. Proliferation of TE-1 and Eca-109 cells was facilitated or suppressed after the upregulation or downregulation of miR-196b compared to untreated cells. (a) and (b) expression level of miR-196b was determined in TE-1 and Eca-109 cells by qRT-PCR after transfection with miR-196b mimic, inhibitor, or NCs. (c) and (d) proliferative capacity of TE-1 and Eca-109 cells were measured by CCK-8. (e) and (f) Migratory ability of TE-1 and Eca-109 cells were measured by transwell assay (magnification 200×). (g) and (h) Invasive ability of TE-1 and Eca-109 cells were measured by transwell assay (magnification 200×). The above analysis was performed using one-way ANOVA by graphpad prism software. *P < 0.05, ***P < 0.001
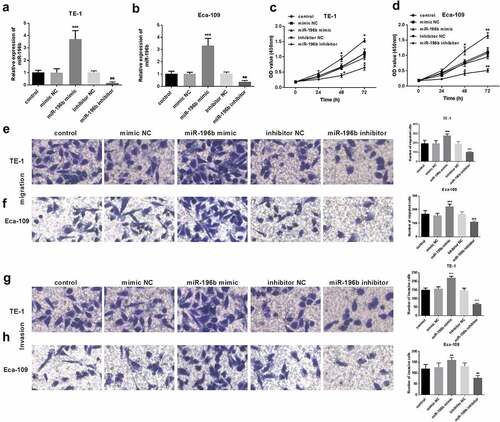
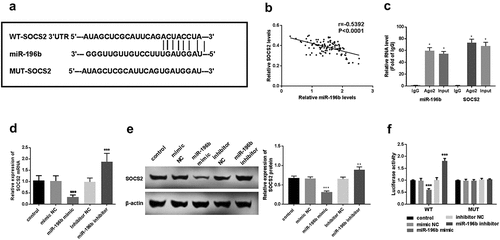
Figure 4. miR-196b interacted with SOCS2. (a) the binding site between SOCS2 and miR-196b is shown. (b) spearman correlation analysis revealed the negative correlation between miR-196b and SOCS2 expression. (c) the cell lysate was incubated with an anti-AGO2 antibody for RIP, and the SOCS2 content was measured by RT-PCR. (d) expression of SOCS2 mRNA was detected using qRT-PCR in TE-1 cells with upregulated or downregulated expression of miR-196b. (e) the expression of SOCS2 protein was measured using a western blot assay. (f) luciferase activity of WT-SOCS2 TE-1 cells group was weakened or enhanced by miR-196b overexpression or knockdown, respectively, but luciferase activity has no change in MUT-SOCS2 TE-1 cells by miR-196b. The above analysis was performed by graphpad prism software.***P < 0.001