Figures & data
Figure 1. EWSR1 expression between tumor and non-tumor liver tissues in HCC patients in TCGA (a) and GEO (b) datasets, and our cohort (c). Hematoxylin and eosin staining of HCC (left) and paratumoral, healthy (right) tissues (d). Positive immunohistochemical staining of EWSR1 in HCC (right), negative in paratumoral normal (left) tissue (e). Scale: 100 μm. Abbreviations: GEO, Gene Expression Omnibus; HCC, hepatocellular carcinoma; TCGA, The Cancer Genome Atlas
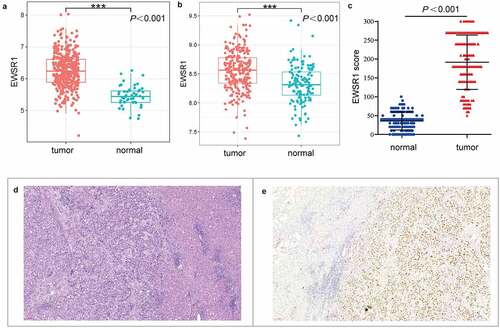
Table 1. Correlation between EWSR1 expression and clinicopathological parameters of HCC patients in the TCGA cohort
Table 2. Correlation between EWSR1 expression and clinicopathological parameters of HCC patients in our cohort
Table 3. Univariate and multivariate Cox regression analyses of DFS in HCC patients
Table 4. Univariate and multivariate Cox regression analyses of OS in HCC patients
Figure 2. Comparison of the 5- and 10-year overall survival between EWSR1 high and low groups in The Cancer Genome Atlas (TCGA) dataset (a, b) and our cohort (c, d)
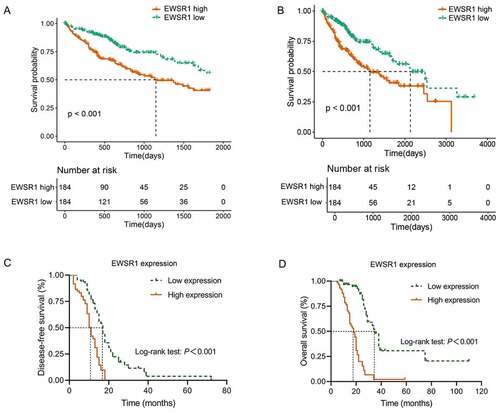
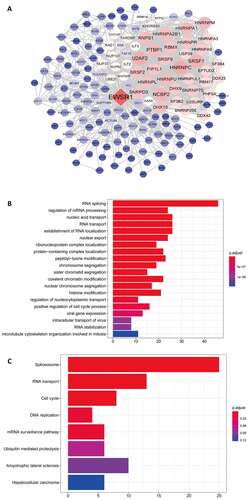
Figure 3. Protein-protein interaction network of EWSR1 (a). Gene ontology (GO) (b) and Kyoto Encyclopedia of Genes and Genomes (KEGG) pathway (c) analyses of coexpressed genes of EWSR1.