Figures & data
Table 1. The specific primer for the qRT-PCR
Table 2. The sequences of lncRNA NHEG1 siRNA, miR-665 mimic, miR-665 inhibitor, and HGMB1 siRNA
Figure 1. LncRNA NHEG1 expression is significantly upregulated in NB tissues and cell lines. A. LncRNA NHEG1 expression level in NB tumor samples and adjacent normal tissues (n = 60), *** P < 0.001. B. LncRNA NHEG1 expression level in NB cell lines (SK-N-BE, SH-SY5Y, SK-N-SH, LAN-6) and normal dorsal root ganglia cell (DG). (n = 3 experiments). *** P < 0.001 vs. DG cells. C-D. Kaplan Meier curve and log-rank test were used to compare the overall survival (OS) and progression-free survival (PFS) between lncRNA NHEG1 high expression (n = 30) and low expression NB patients (n = 30)
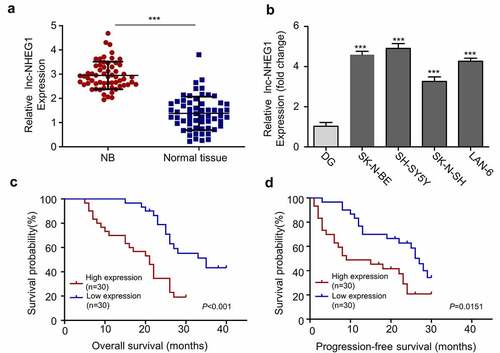
Table 3. Summary of clinicopathological information of all patients included in this study
Figure 2. Silencing lncRNA NHEG1 inhibits proliferation, migration and invasion in NB cells. A. qRT-PCR analysis of lncRNA NHEG1 expression level in NB cells (SK-N-BE, SH-SY5Y) after transfection with si-lncNHEG1 #1 and #2. B. CCK-8 cell proliferation assay of NB cells treated with si-lncNHEG1#1. C. Colony formation assay in NB cells treated with si-lncNHEG1#1. D. Cell migration assay in NB cells treated with si-lncNHEG1#1. E. Cell invasion assay in NB cells treated with si-lncNHEG1#1. All experiments were performed 3 times and data were presented as mean ± SD. **P < 0.01 vs. si-NC group. ***P < 0.001 vs. si-NC group
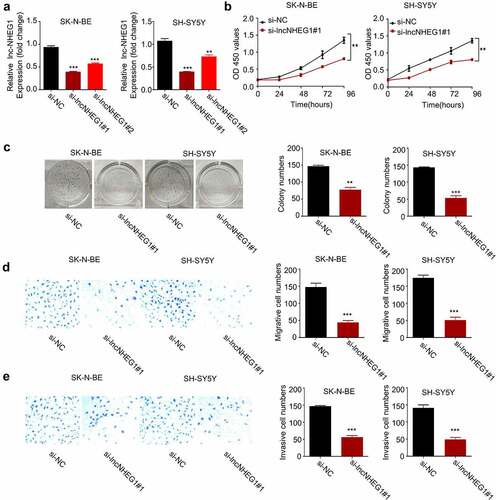
Figure 3. miR-665 was a downstream target of lncRNA NHEG1. A. Predicted binding site of miR-665 at the 3ʹUTR of lncRNA NHEG1. Wildtype binding site (WT-NHEG1) or mutated sequence (MUT-NHEG1) was cloned into luciferase reporter and dual luciferase reporter assay was performed in the presence or absence of miR-665 mimic (mim). n = 3 experiments. **P < 0.01 vs. miR-665-NC. B. miR-665 expression level was detected by qRT-PCR after transfection with si-lncNHEG1#1 in NB cells. n = 3 experiments, **P < 0.01 vs. si-NC group, ***P < 0.001 vs. si-NC group. C. miR-665 expression levels in NB tissues and adjacent normal tissues (n = 60). ***P < 0.001 vs. normal tissue. D. The correlation between lncRNA NHEG1 expression and miR-665 expression among the 60 NB tumor samples. E-F. Kaplan Meier curve and log-rank test were used to compare the overall survival (OS) (e) and progression-free survival (PFS) (f) between miR-665 high expression (n = 30) and miR-665 low expression NB patients (n = 30)
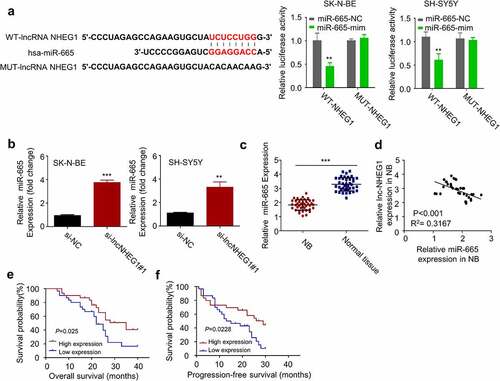
Figure 4. LncRNA NHEG1 knockdown decreased HMGB1 expression via sponging miR-665. A. Predicted miR-665 binding site in HMGB1 3ʹUTR. Wildtype binding site (WT-HMGB1) or mutated sequence (MUT-HMGB1) was cloned into luciferase reporter and dual luciferase reporter assay was performed in the presence or absence of miR-665 mimic (mim). n = 3 experiments. **P < 0.01 or ***P < 0.001 vs. miR-665-NC. B. HMGB1 expression level was determined by qRT-PCR and western blot after the treatment with miR-665 mimic or miR-665-inhibitor in NB cells. n = 3 experiments. *P < 0.05, **P < 0.01, ***P < 0.001 vs. mir-NC group. C. HMGB1 expression levels was determined by qRT-PCR and western blot after the treatment with si-lncNHEG1#1 or in the combination with miR-665-inhibitor. n = 3 experiments. *P < 0.05 vs. si-NC group, **P < 0.01 vs. si-NC group, #P < 0.05 vs. si-lncNHEG1#1 group, ##P < 0.01 vs. si-lncNHEG1#1 group. D. The correlation between lncRNA NHEG1 expression and HMGB1 expression in 60 NB tumor samples. E. The correlation between miR-665 expression and HMGB1 expression in in 60 NB tumor samples. F-G. Kaplan Meier curve and log-rank test were used to compare the overall survival (OS) (f) and progression-free survival (PFS) (g) between HMGB1 high expression (n = 30) and HMGB1 low expression NB patients (n = 30)
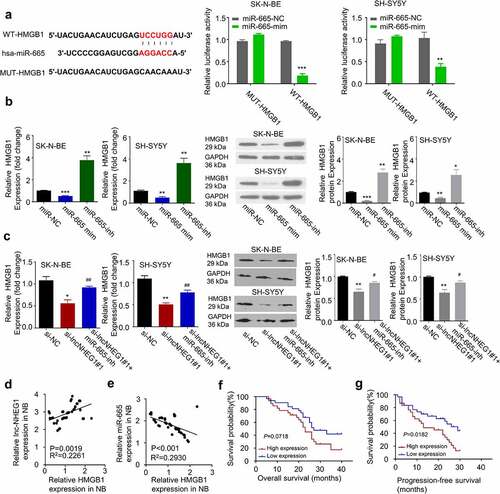
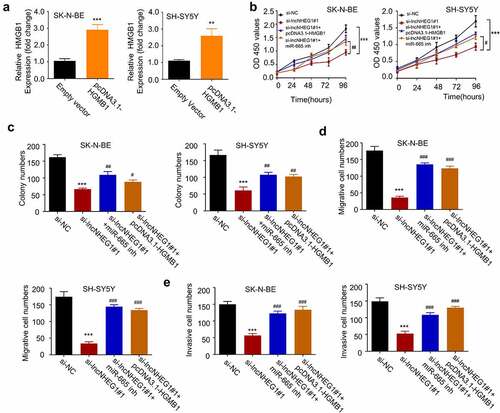
Figure 5. LncRNA NHEG1/miR-665/HMGB1 axis is involved in regulating the malignant phenotype of NB cells A. HMGB1 expression level was determined by qRT-PCR after transfection with pcDNA3.1-HMGB1 in NB cells. B. CCK-8 cell proliferation assay NB cells treated with si-NC, si-lncNHEG1#1, si-lncNHEG1#1+ miR-665 inhibitor, or si-lncNHEG1#1+ pcDNA3.1-HMGB1. C. Colony formation experiment was performed in NB cells with the above treatments. D. Cell migration experiment in NB cells treated with the above treatments. E. Cell invasion experiment in NB cells with the above treatments. All experiments were performed 3 times and data were presented as mean ± SD. **P < 0.01, ***P < 0.001 vs. si-NC group. #P < 0.05, ##P < 0.01, ###P < 0.001 vs. si-lncNHEG1#1 group