Figures & data
Table 1. The clinical data for the patient in this study
Figure 1. The expression of PD-L1, PD-1 and IGF2BP2 in pyriform sinus of healthy individuals and patients with hypopharyngeal carcinoma. The protein expression of PD-L1 (a) and PD-1 (b). (c) The immumohistochemical staining for PD-L1 (scale bar, 40 μm). (d) The protein expression of IGF2BP2 in normal and cancer tissues. *P < 0.05 and ***P < 0.001 vs normal group
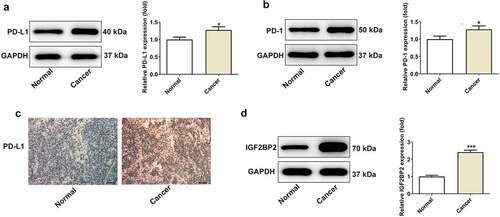
Figure 2. The effects of IGF2BP2 knockdown on cell viability and apoptosis. (a) The mRNA and protein expressions of IGF2BP2 in various hypopharyngeal carcinoma cells relative to normal cells NP69SV40T. *P < 0.05 and ***P < 0.001 vs NP69SV40T. (b) The mRNA and protein expressions of IGF2BP2 in FaDu cells or cells that transfected with shRNA-NC or shRNA-IGF2BP2. ***P < 0.001 vs control. (c) The cell viability of FaDu cells or cells that transfected with shRNA-NC or shRNA-IGF2BP2 at different times. *P < 0.05 and ***P < 0.001 vs shRNA-NC. (d) TUNEL staining images of FaDu cells or cells that transfected with shRNA-NC or shRNA-IGF2BP2. The nucleus was stained with blue and apoptotic cells were stained with green (scale bar, 50 μm)
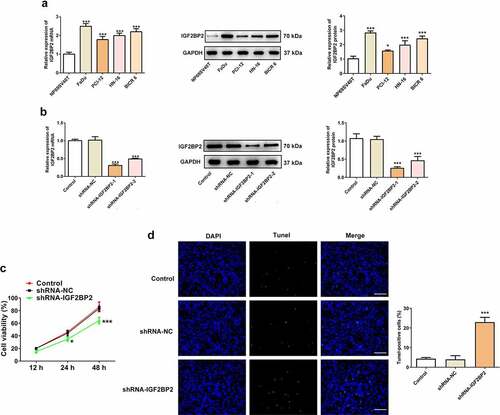
Figure 3. The effects of IGF2BP2 knockdown on proteins involved in apoptosis and cell cycle. (a) the protein expression of IGF2BP2, PD-L1, Bcl-2 and cleaved-caspase 3 (C-caspase-3). (b) the protein expression of cyclin B, D and E in control FaDu cells or cells that transfected with shRNA-NC or shRNA-IGF2BP2. **P < 0.01 and ***P < 0.001 vs shRNA-NC
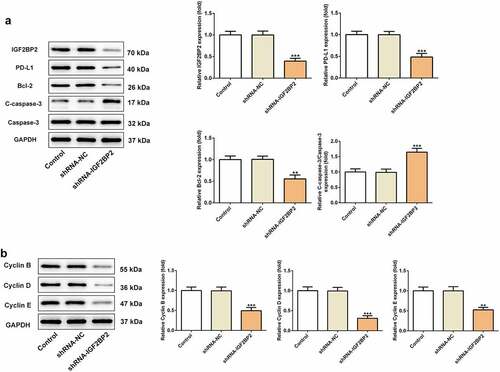
Figure 4. The effects of PD-L1 inhibitor and IGF2BP2 knockdown on hypopharyngeal carcinoma tumor growth in xenograft nude mice. (a) Representative images of xenograft nude mice in different groups. The body weight (b) and tumor volumes (c) of mice in different groups at different days post transplantation. Representative images (d) and weight (e) of tumors in different groups at 21-day post transplantation. *P < 0.05, **P < 0.01 and ***P < 0.001 vs control; #P < 0.05, ##P < 0.01 and ###P < 0.001 vs shRNA-NC
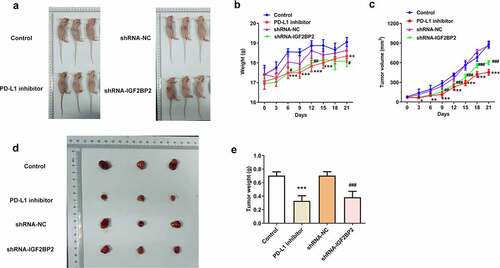
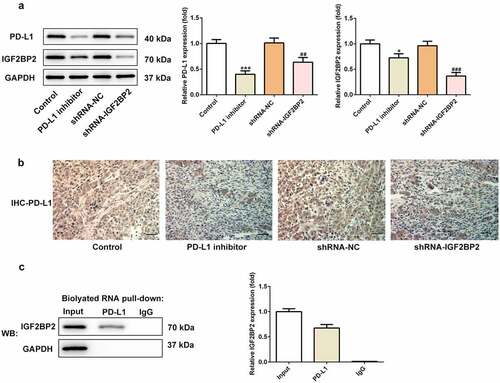
Figure 5. The relationship between IGF2BP2 and PD-L1. (a) the protein expression of PD-L1 and IGF2BP2 in tumor tissues of nude mice in different groups. (b) the immumohistochemical staining for PD-L1 in tumor tissues of nude mice in different groups (scale bar, 40 μm). (c) RNA pull-down assay was utilized to detect the interaction between IGF2BP2 and PD-L1 RNA. *P < 0.05 and ***P < 0.001 vs control; ##P < 0.01 vs shRNA-NC