
Figures & data
Table 1. Relationship between hsa_circ_0000751 expression and clinicopathological factors
Table 2. Sequences of primers used for quantitative RT-PCR assay
Figure 1. Identification and characterization of hsa_circ_0000751. (a) The heat map of circRNAs expression profiles in normal and GC tissues analyzed from GEO database (GSE83521). Red represents high level and blue indicates low level of transcript abundances. (b) Hsa_circ_0000751 expression was validated in GC tissues and adjacent normal tissues via qRT-PCR. (c) Hsa_circ_0000751 expression in GC cells lines and normal human gastric epithelial cell using qRT-PCR. (d) Gel electrophoresis shows that hsa_circ_0000751 can be amplified by divergent primers using total cDNA, but not genomic DNA (gDNA). (e) Relative expression of hsa_circ_0000751 and NUFIP2 mRNA in both MKN-45 and MGC-803 cells was detected by qRT-PCR in the presence or absence of RNase R. Data were represented as means ± S.D. of at least three independent experiments.**P < 0.01
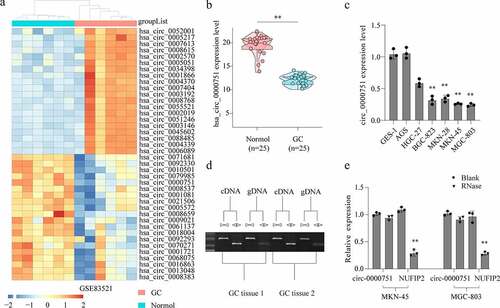
Figure 2. Hsa_circ_0000751 affects the proliferation, apoptosis and invasion abilities of GC cells. (a) The expression levels of hsa_circ_0000751 and NUFIP2 mRNA in MKN-45 and MGC-803 cells after transfection with hsa_circ_0000751 or control vector plasmids were detected by qRT-PCR. The blank group contains untreated cells. (b) The effect of hsa_circ_0000751 on cell viability was determined via CCK-8 assays. (c-d) The multiplication of GC cells was detected by clone formation assay and EdU assay. (e) The effect of hsa_circ_0000751 on cell invasion was determined via Transwell assay. (f) The effect of hsa_circ_0000751 on cell migration was determined via wound scratch assay. (g) TUNEL assay confirmed the incidence of apoptosis (Scale bar = 200 μm). (h) Apoptosis-related molecules expression was determined by western blot. Data are the means ± SD of triplicate determinants. *P < 0.05, **P < 0.01
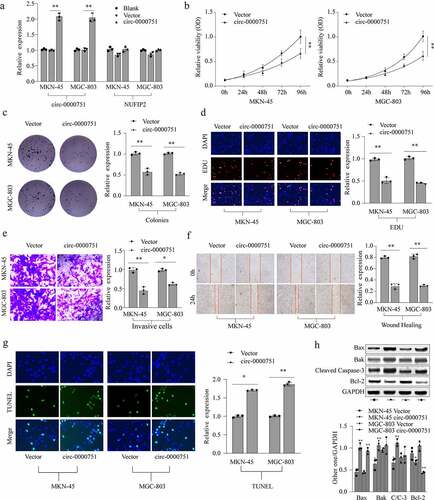
Figure 3. Hsa_circ_0000751 suppresses the growth of GC tumor in vivo. (a-d) MKN-45 cells were transfected with mock or lentivirus-hsa_circ_0000751-overexpression vectors. The stable hsa_circ_0000751 overexpression MKN-45 cells (5 × 10⁶ cells) were injected into nude mice, and tumors were allowed to develop for 1, 3 and 5 weeks. Representative images of the mice are shown, and the tumor weight and volumes were determined. (e) Ki-67 staining by immunohistochemical analysis of the xenograft tumors. Data are the means ± SD of triplicate determinants. **P < 0.01
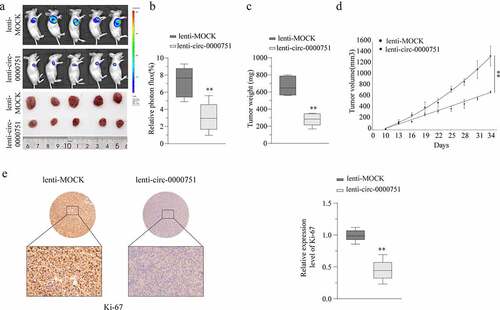
Figure 4. Hsa_circ_0000751 acted as a molecular sponge for miR-488. (a) Schematic representation of the targeting sites between hsa_circ_0000751 and the miR-488. (b) The Pearson’s correlation coefficients were used to evaluate the correlation between hsa_circ_0000751 and miR-488 in GC tissues (n = 25) (r = −0.61, P < 0.001). (c) The relative expression of miR-488 in 25 GC tissues was significantly higher than that in adjacent tissues. (d) qRT-PCR analysis of miR-488 expression in GES-1 and GC cell lines. (e) The effects of hsa_circ_0000751 on the expression of miR-488 were detected by qRT-PCR. (f) The luciferase activity of wild type hsa_circ_0000751 or mutant hsa_circ_0000751 after transfection with miR-488 mimic or inhibitor in HEK-293 T cells. Data are the means ± SD of triplicate determinants. **P < 0.01
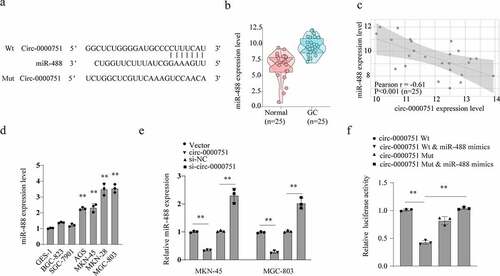
Figure 5. Hsa_circ_0000751 inhibits GC cell proliferation and invasion by targeting miR-488. MKN-45 and MGC-803 cells transfected with control vector, miR-488, hsa_circ_0000751, or miR-488 + hsa_circ_0000751. Then the ability of cell cloning, proliferation and invasion was, respectively, assessed by (a) CCK-8 assay, (b) colony formation assay and (c) transwell invasion assay. Data are the means ± SD of triplicate determinants. **P < 0.01
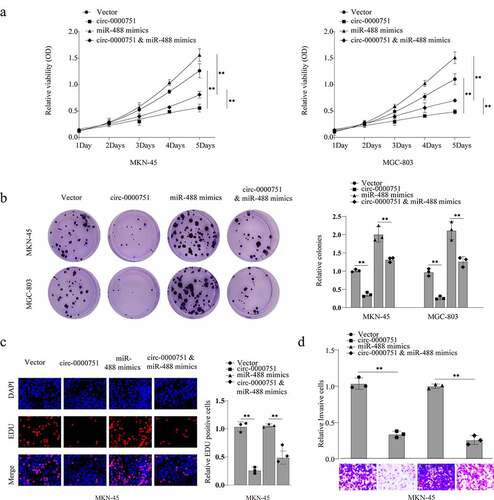
Figure 6. Hsa_circ_0000751 regulates the expression of UQCRC2 by sponging miR-488. (a) Schematic representation of the targeting sites between miR-488 and UQCRC2, which was predicted by Targetscan. (b) The luciferase reporter vector carrying wild type of UQCRC2 or mutant type of UQCRC2 was co-transfected with miR-488 mimics or mimic-NC. (c) UQCRC2 mRNA levels in 25 GC tissue specimens and matched non-carcinoma tissue specimens. (d) The Pearson’s correlation coefficients were used to evaluate the correlation between miR-488 and UQCRC2 in GC tissues (n = 25) (r = −0.62, p < 0.001). (e) The correlation analysis between the RNA level of hsa_circ_0000751 and UQCRC2 in 25 GC tissues (r = 0.72, p < 0.001). (f-g) The mRNA expression level and protein level of UQCRC2 in MKN-45 and MGC-803 cells after transfection with miR-488 mimics alone, miR-488 inhibitors or the corresponding negative controls. The blank group contains untreated cells. (h-i) Hsa_circ_0000751 could significantly promote the mRNA and protein expression of UQCRC2, and the promotion was retarded after co-transfecting with miR-488 mimics. Data are the means ± SD of triplicate determinants. **P < 0.01
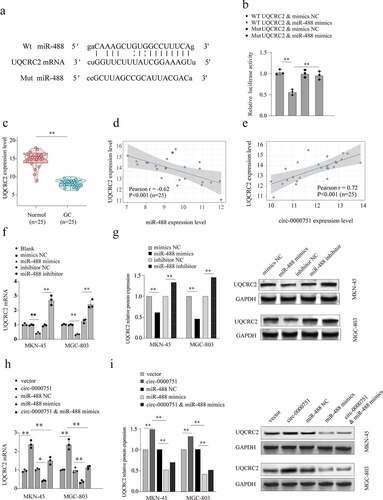
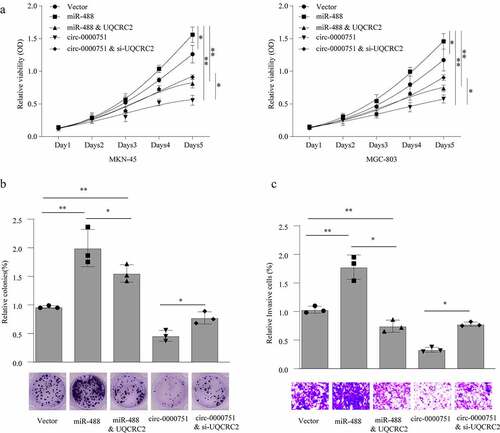
Figure 7. Hsa_circ_0000751 suppresses proliferation and invasion through modulation of the miR-488/UQCRC2 axis in GC cells. MKN-45 and MGC-803 cells transfected with control vector, miR-488 mimics, hsa_circ_0000751 overexpression plasmids, UQCRC2 plasmids or si-UQCRC2. cloning, proliferation and invasion was, respectively, assessed by (a) CCK-8 assay, (b) colony formation assay and (c) transwell invasion assay. Data are the means ± SD of triplicate determinants. *P < 0.05, **P < 0.01
Data Availability Statement
All data generated or analyzed during this study are included in this published article.