Figures & data
Figure 1. Cardiac function indices. *P < 0.05 vs. sham group, #P < 0.05 vs. model group, ∆P < 0.05 vs. low-dose group, ☆P < 0.05 vs. middle-dose group
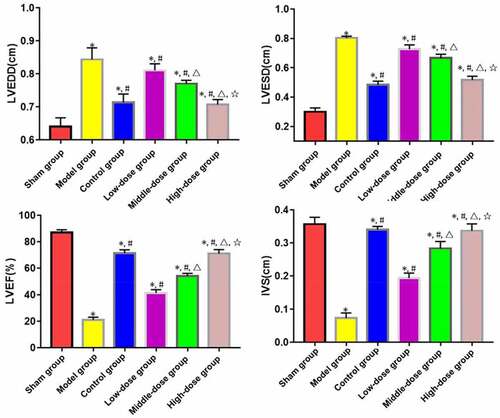
Figure 2. Apoptosis of myocardial cells (×400). *P < 0.05 vs. sham group, #P < 0.05 vs. model group, ∆P < 0.05 vs. low-dose group, ☆P < 0.05 vs. middle-dose group
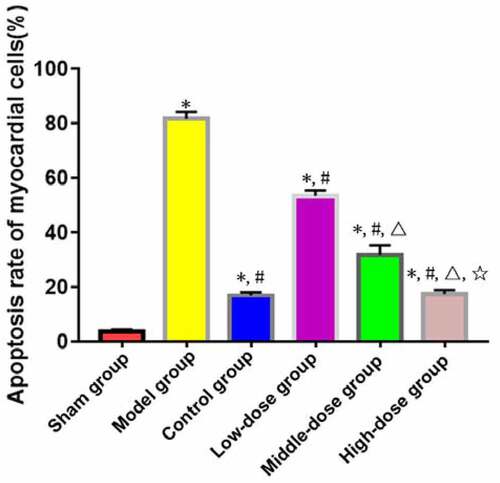
Figure 3. Serum contents of cTnI and PGC-1. *P < 0.05 vs. sham group, #P < 0.05 vs. model group, ∆P < 0.05 vs. low-dose group, ☆P < 0.05 vs. middle-dose group
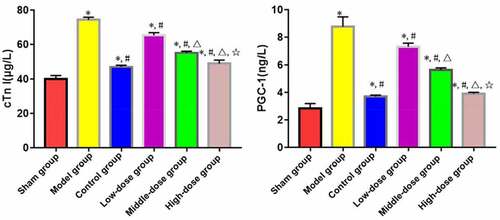
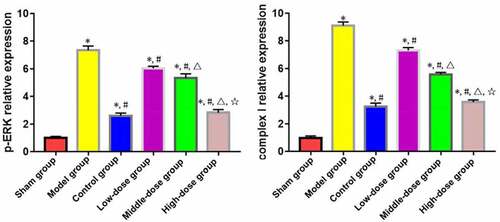
Figure 4. Expressions of complex I and p-ERK in myocardial tissues. *P < 0.05 vs. sham group, #P < 0.05 vs. model group, ∆P < 0.05 vs. low-dose group, ☆P < 0.05 vs. middle-dose group