
Figures & data
Table 1. The association of circ_0054537 expression with clinicopathological characteristics of patients with RCC
Table 2. The sequences of si (sh)-RNAs and RT-qPCR primers
Figure 1. Circ_0054537 was an upregulated circRNA in RCC patients and cells. (a-d) RT-qPCR compared (a) circ_0054537 level between cancer tissues and normal tissues from RCC patients (n = 39), (b) circ_0054537 level between cancer cells (786-O and A498) and normal cells (HK-2), (c, d) circ_0054537, U6 and β-actin levels between nucleus and cytoplasm of 786-O and A498 cells. (e) RNA-FISH detected subcellular location of circ_0054537 in 786-O and A498 cells. Nucleus was stained with DAPI. (f, g) circ_0054537 and PSME4 mRNA levels between RNase R+ and RNase R− groups in786-O and A498 cells. ***P < 0.001
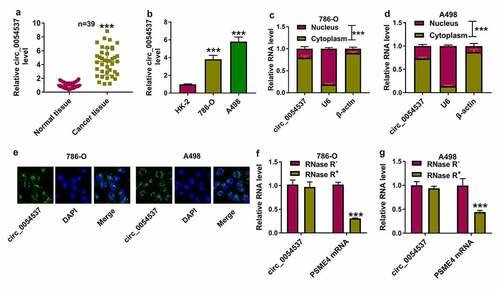
Figure 2. Circ_0054537 deletion boycotted cancer properties of RCC cells in vitro. (a, b) RT-qPCR compared circ_0054537 level between si-con transfection and si-circ_0054537 (#1, #2 and #3) transfection in 786-O and A498 cells. (c, d) CCK-8 assay compared OD values, (e, f) transwell assays compared migration cell number, (g, h) transwell assays with Matrigel compared invasion cell number, (I, J, M, N) western blotting compared protein levels of LC3 II/I, MMP-9 and Bax, (k, l) FCM compared apoptotic rate (%), (o, p) XF96 extracellular flux analyzer compared ECAR (mpH/minute), and (q, r) ATP assay Kit compared ATP level between si-con transfection and si-circ_0054537#1 transfection in 786-O and A498 cells. **P < 0.01 and ***P < 0.001
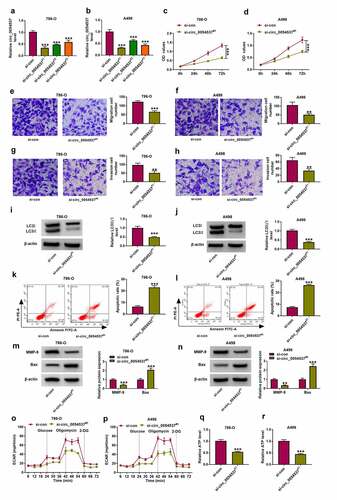
Figure 3. miR-640 was downregulated in RCC and correlated with circ_0054537 via targeting. (a, b) GSE61741 compared miRNAs levels including miR-640 in peripheral bloods between renal cancer patients and normal controls. (c, e) RT-qPCR detected miR-640 level in 39 RCC patients’ tissues and cells (HK-2, 786-O and A498). (d) Pearson’s correlation analysis analyzed the correlation between circ_0054537 and miR-640 levels in RCC tissues. (f) The predicted miR-640-binding sites in circ_0054537-WT were mutated. (g, h) Dual-luciferase reporter assay system compared luciferase activity of circ_0054537-WT/MUT vectors between miR-con mimic (miR-con) transfection and miR-640 mimic (miR-640) transfection in 786-O and A498 cells. (i, j) RIP assay detected RNA enrichment of circ_0054537 and miR-640 between anti-Ago2-mediated complex and anti-IgG-mediated complex. (k) RT-qPCR compared miR-640 level between si-con-transfected 786-O and A498 cells and si-circ_0054537#1-transfected above cells. ***P < 0.001
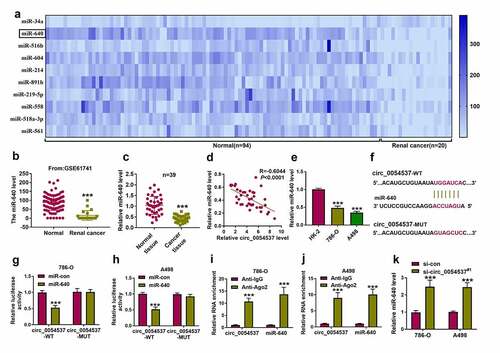
Figure 4. miR-640 inhibition promoted cancer properties of RCC cells with circ_0054537 deletion in vitro. (a-d) RT-qPCR compared miR-640 level in 786-O and A498 cells transfected with in-miR-con, in-miR-640, si-con, or si-circ_0054537#1, and co-transfected with si-circ_0054537#1 and in-miR-con or in-miR-640. (e, f) CCK-8 assay compared OD values, (g-j) transwell assays compared migration cell number and invasion cell number, (K, L, O, P) western blotting compared LC3 II/I, MMP-9 and Bax protein levels, (m, n) FCM compared apoptotic rate (%), (q, r) XF96 extracellular flux analyzer compared ECAR (mpH/minute), and (s, t) ATP assay Kit compared ATP levels between transfections of si-con and si-circ_0054537#1, and co-transfections of si-circ_0054537#1 with in-miR-con or in-miR-640 in 786-O and A498 cells. *P < 0.05, **P < 0.01 and ***P < 0.001
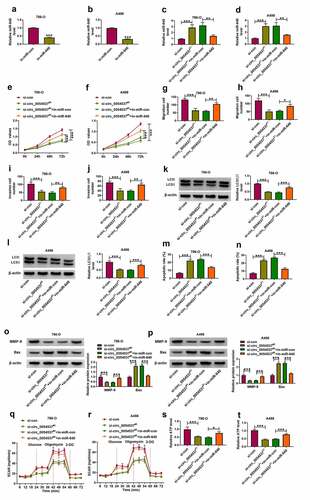
Figure 5. NPTX2 was upregulated in RCC and targeted by miR-640. (a) GEPIA showed NPTX2 expression on box plots in kidney renal clear cell carcinoma (KIRC, also named as ccRCC) tumor tissues and normal tissues. (b) RT-qPCR detected NPTX2 mRNA level in tissues from 39 RCC patients. (c) Pearson’s correlation analysis analyzed the correlation between miR-640 and NPTX2 mRNA levels in RCC tissues. (d, e) Western blotting detected PTX2 protein level in 39 RCC patients’ tissues and cells (HK-2, 786-O and A498). (f) The predicted miR-640-binding sites in NPTX2-3ʹUTR-WT were mutated. (g, h) Dual-luciferase reporter assay compared luciferase activity of NPTX2-3ʹUTR-WT/MUT vectors between miR-con transfection and miR-640 transfection in 786-O and A498 cells. (i, j) RIP assay detected RNA enrichment of miR-640 and NPTX2 mRNA between anti-Ago2-mediated complex and anti-IgG-mediated complex. (k) Western blotting compared NPTX2 protein level between in-miR-con transfection and in-miR-640 transfection in 786-O and A498 cells. **P < 0.01 and ***P < 0.001
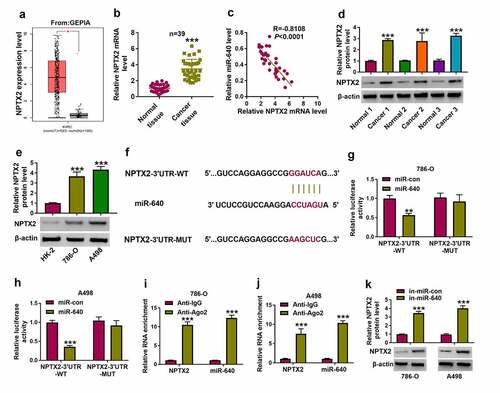
Figure 6. NPTX2 upregulation abrogated the tumor-suppressive role of miR-640 in RCC cells in vitro. (a) RT-qPCR detected miR-640 level and (b-d) western blotting detected PTX2 protein level in 786-O and A498 cells transfected with miR-con, miR-640, pcDNA vector, or pcDNA-NPTX2 (NPTX2) vector, and co-transfected with miR-640 and pcDNA or NPTX2 vector. (e, f) CCK-8 assay compared OD values, (g-j) transwell assays compared migration cell number and invasion cell number, (K, L, O, P) western blotting compared LC3 II/I protein level, (m, n) FCM compared apoptotic rate (%), (q, r) XF96 extracellular flux analyzer compared ECAR (mpH/minute), and (s, t) ATP assay Kit compared ATP levels between transfections of si-con and si-circ_0054537#1, and co-transfections of si-circ_0054537#1 with in-miR-con or in-miR-640 in 786-O and A498 cells. *P < 0.05, **P < 0.01 and ***P < 0.001
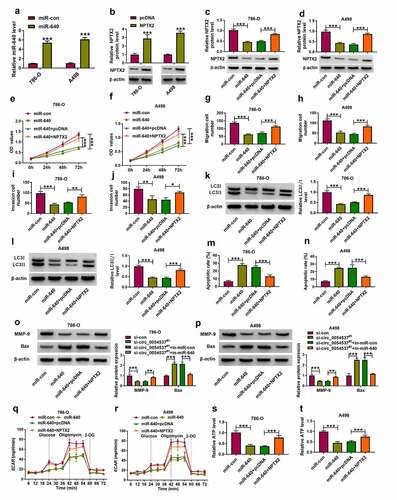
Figure 7. NPTX2 expression was correlated with circ_0054537 in RCC via miR-640. (a) Pearson’s correlation analysis analyzed the correlation between circ_0054537 and NPTX2 mRNA levels in RCC tissues. (b, c) Western blotting detected PTX2 protein level in 786-O and A498 cells transfected with si-con or si-circ_0054537#1, and co-transfected with si-circ_0054537#1 and in-miR-con or in-miR-640. ***P < 0.001
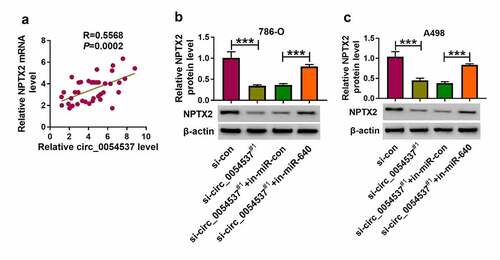
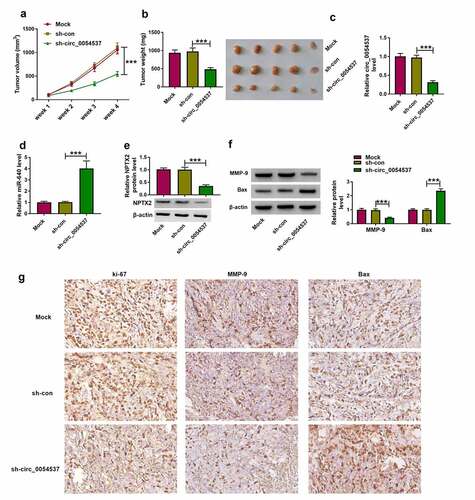
Figure 8. Circ_0054537 deletion retarded tumor growth of RCC in nude mice by regulating miR-640 and NPTX2. (a) Tumor volume in xenograft mice was monitored every week for 4 weeks. (b) Tumor weight was examined, (c, d) RT-qPCR detected circ_0054537 and miR-640 expression, (e) western blotting examined NPTX2 expression, and (f, g) western blotting and/or IHC measured expression of MMP-9, Bax and ki-67 in xenograft mice after 4 weeks. ***P < 0.001
Supplemental Material
Download ()Data availability statement
All data generated or analysed during this study are included in this published article (and its supplementary information files).