Figures & data
Table 1. The primers of hub genes for RT-PCR
Figure 1. Identification of DEGs. (a). The number of DEGs in different groups; (b). The venn picture showing up-regulated genes; (c). The venn picture displaying down-regulated genes
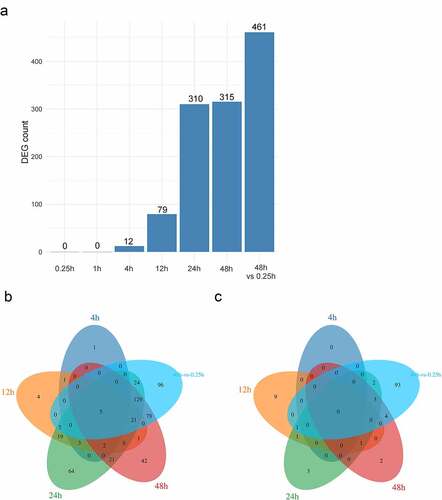
Figure 2. Analysis of the ferroptosis Z-score and the hypoxia Z-score. (a). The ferroptosis Z-score in LV, FW, and IF group; (b). The hypoxia Z-score in LV, FW, and IF groups; (c). The correlation analysis between ferroptosis Z-score and hypoxia Z-score; (d). The relationship between ferroptosis Z-score and time in the LV, FW, and IF groups; (e). The relationship between hypoxia Z-score and time in the LV, FW, and IF groups
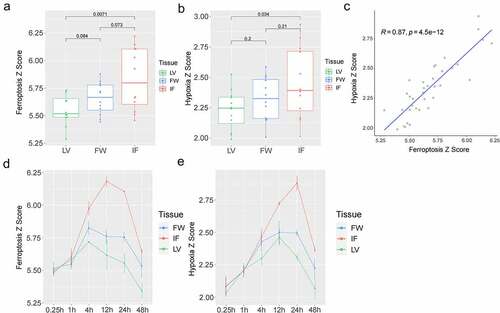
Figure 3. The co-expression modules analysis. (a). Clustering dendrogram of 36 samples; (b). The relationship between the scale-free fit index and various soft-thresholding powers; (c). The relationship between the mean connectivity and various soft-thresholding powers; (d). Clustering dendrogram of genes, various colors represent different modules
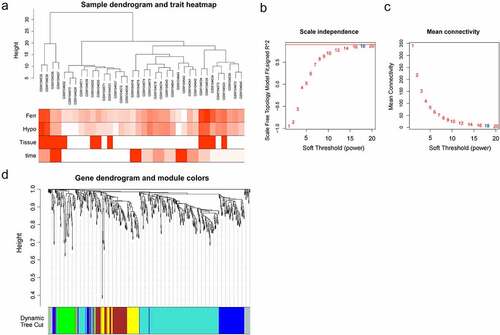
Figure 4. The clinically important modules analysis. (a). The relationship of four traits and six modules; (b). The scatterplot describing the relationship between MM and GS in green module; (c). The scatterplot describing the relationship between MM and GS in the yellow module
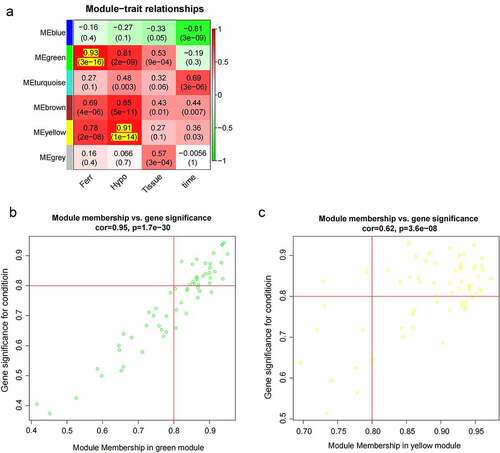
Figure 5. The gene functional enrichment analysis of two clinically important modules. (a). GO enrichment in the green module; (b). GO enrichment in the yellow module; (c). KEGG enrichment in the green module; (d). KEGG enrichment in the yellow module
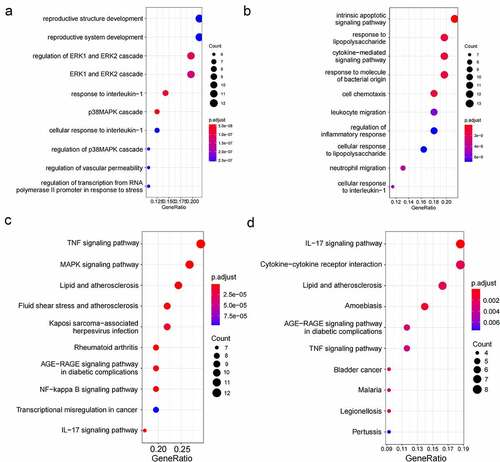
Figure 6. The PPI analysis of key genes. (a). The PPI network of green module; (b). The PPI network of yellow module; (c). Top 5 hub genes in the green module; (d). Top 5 hub genes in the yellow module; (e). The expression of 10 hub genes in GSE4648
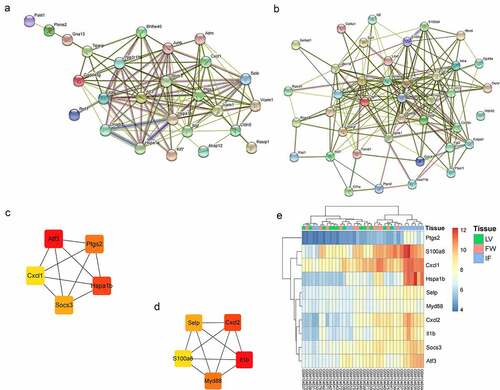
Figure 7. The expression level of hub genes in GSE775. (a). Atf3; (b), Cxcl2; (c). Hspa1b; (d). Il1b; (e). Myd88; (f). Ptgs2; (g). S100a8; (h). Selp; (i). Socs3.
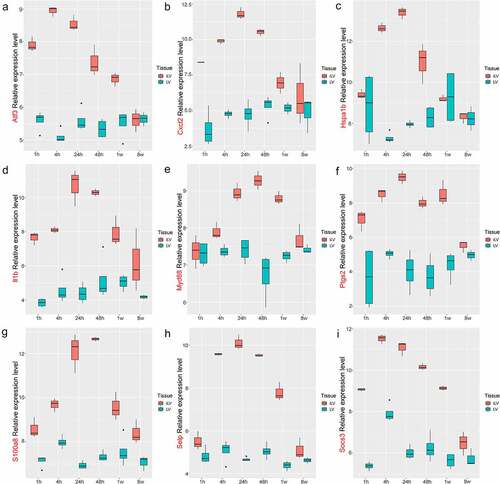
Figure 8. TF-hub genes interaction network. Diamonds represent TFs, squares represent hub genes, red indicated up-regulation of gene expression, and gray indicated no significant difference in the expression
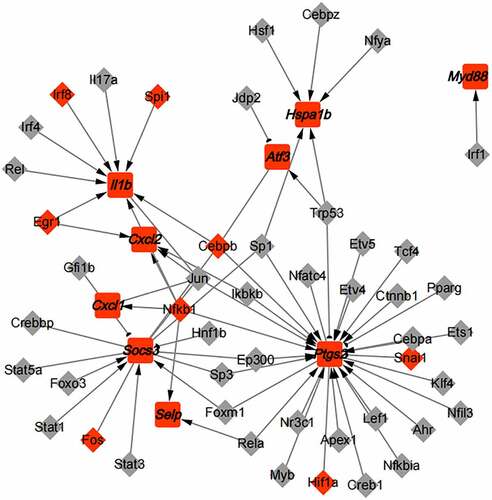
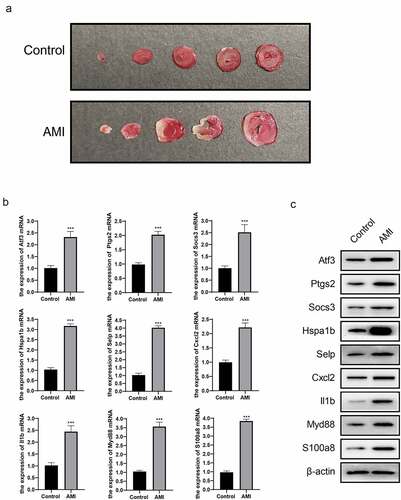
Figure 9. Expression of hub genes in AMI mice myocardial tissue. (a). TTC staining (white is the infarct area); (b). Relative expression level of the hub genes mRNA; (c). Protein expression levels of hub genes