
Figures & data
Figure 1. Correlations between the expression levels of E2F members and different clinical characteristics of patients with LGG. (a-d): Expression of eight E2F genes in LGG of different WHO grades. (e-f): Expression of eight E2F genes in patients with differential IDH status from the CGGA (e) and TCGA datasets (f). * P< 0.05, ** P< 0.01, and *** P< 0.001
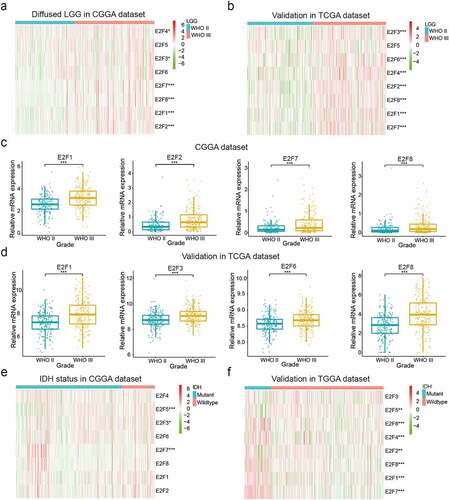
Figure 2. Two categories of patients based on distinct clinical characteristics and OS according to the gene expression of eight E2Fs in the CGGA dataset. (a): Spearman’s correlation analysis of the E2F family members. (b): CDFs for K = 2–9. (c): Delta areas under the CDF curves for K = 2–9. (d): Clinical characteristics of the two clusters defined based on the consensus expression of the eight members of the E2F family. (e): PCA of total RNA expression profile in the CGGA datasets. (f): Kaplan-Meier curves for samples in the CGGA datasets
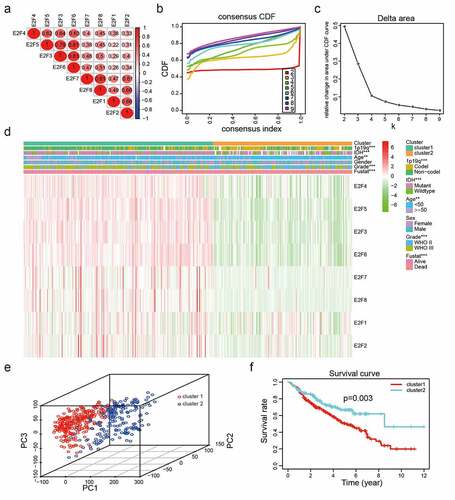
Figure 3. Functional annotations of differentially expressed genes between cluster1 and cluster2. (a): Functional annotations of differentially expressed genes via GO and KEGG pathway analyses. (b): Malignant hallmarks enriched in cluster1 determined using GSEA
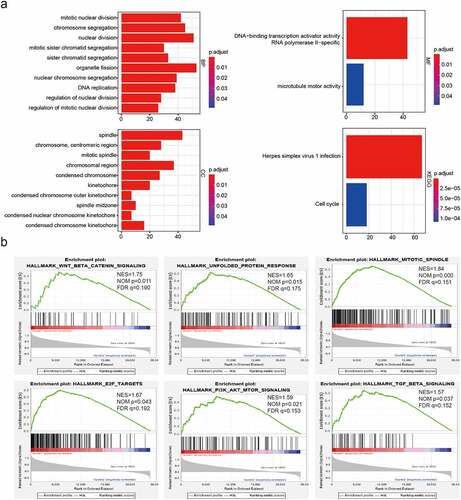
Figure 4. Risk models derived from expression patterns of four E2F genes. (a): The process of risk model construction. (b-c): Kaplan-Meier OS curves for patients from the CGGA (b) and TCGA (c) datasets categorized into two groups based on the median risk scores. (d-e): ROC curve analysis of the predictive efficiency of our risk model in the CGGA (d) and TCGA (e) datasets. (f): Heatmap of genes corresponding to four E2F genes and the distributions of clinical characteristics in the two subgroups. * P< 0.05, ** P< 0.01, and *** P< 0.001
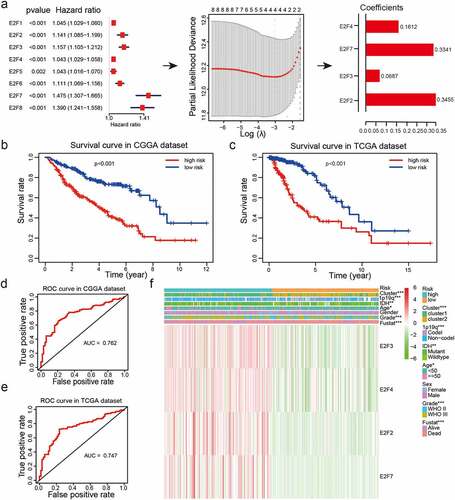
Figure 5. Correlations between risk scores, clinical characteristics and clusters. (a-f): Distributions of risk scores stratified by WHO grade (a), age (b), 1p/19q status (c), IDH status (d), sex (e), and cluster (f). (g-j): Predictive efficiency of risk score, WHO grade and age relative to the survival rate (g), cluster1 group (h), IDH status (i) and 1p/19q codel status (j). (k-l): Relationships between clinical characteristics and OS of patients in the CGGA (k) and TCGA (l) datasets determined via univariate and multivariate Cox regression analyses. (m-n): Kaplan-Meier analysis of gliomas different WHO grades from the CGGA dataset. ns P> 0.05, * P< 0.05, ** P< 0.01, and *** P< 0.001
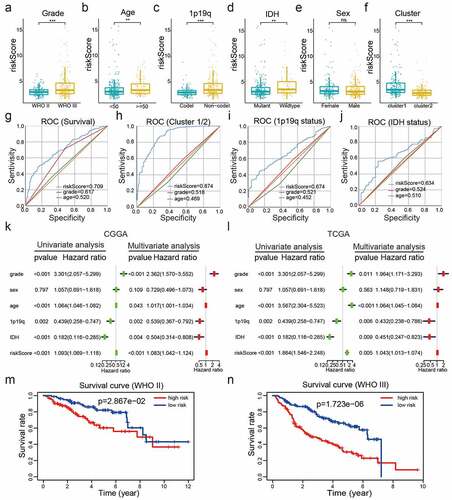
Figure 6. Construction and assessment of a nomogram to predict patient’ OS. (a): Nomogram based on the clinical characteristics and risk scores for predicting patient survival. (b-d): Calibration curve for predicting patient survival at 2 years (b), 3 years (c), and 5 years (d). (e-g): The predictive efficiency of the risk scores, WHO grade, and age showed by ROC curves based on 2- (e), 3- (f), and 5- (g) year survival rates
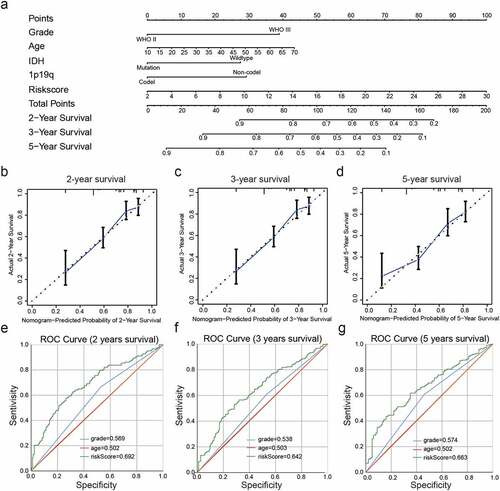
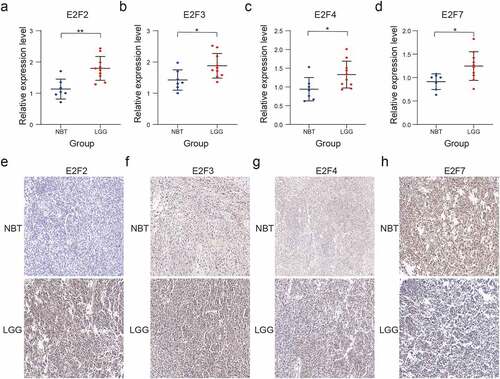
Figure 7. Validation of four selected E2F members by RT-qPCR and immunohistochemistry analysis. (a-d): Comparative E2F2 (a), E2F3 (b), E2F4 (c), and E2F7 (d) mRNA expression levels in NBT and LGG tissues. (e-h): Comparative E2F2 (e), E2F3 (f), E2F4 (g), and E2F7 (h) protein expression levels in NBT and LGG tissues by immunohistochemistry assay. ns P > 0.05, * P < 0.05, ** P < 0.01, and *** P < 0.001
Supplemental Material
Download ()Data availability statement
Data for this work were obtained from the CGGA (http://www.cgga.org.cn/), TCGA (https://portal.gdc.cancer.gov/), GSE16011 (https://www.ncbi.nlm.nih.gov/geo/query/acc.cgi?acc=GSE16011), ONCOMINE (https://www.oncomine.org/), and Human Protein Atlas datasets (https://www.proteinatlas.org/).