
Figures & data
Table 1. The clinicopathological characteristics of OS patients
Figure 1. Overexpression of circATRNL1 indicated the unfavorable prognosis of osteosarcoma patients. (a) schematic diagram illustrated the genesis of circATRNL1 from the ATRNL1 gene loci through backsplicing. (b) screening analysis using the RT-PCR discovered the potential up/down-expressed circRNA in the osteosarcoma tissue and normal tissue. (c) sanger sequencing revealed the junction sites of circATRNL1 using the cDNA in the cells. (d) act D administration and (e) RNase R administration were performed to detect the stability of circATRNL1 and ATRNL1 mRNA. the levels of RNA were measured by RT-PCR. (f) in the enrolled osteosarcoma patients’ specimens, circATRNL1 expression was detected using RT-PCR. (g) clinically, the patients with high-expression of circATRNL1 demonstrated a lower prognosis than who with low-expression of circATRNL1. two-group comparison was calculated by student’s t-test. experiments were performed in triplicate. multiple group comparison was calculated by one-way analysis of variance (ANOVA). data are presented as mean ± SD. *p < 0.05, **p < 0.01
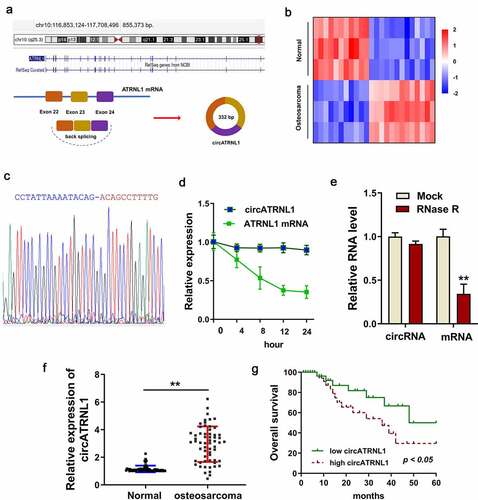
Figure 2. CircATRNL1 promoted the glycolytic capacity of osteosarcoma cells in vitro. (a) RT-PCR illustrated that expression of circATRNL1 in the osteosarcoma cells (U2OS, saos-2, MG63) as compared to the normal cell (hFOB). (b) cellular transfections were constructed by plasmids stable transfection for up-regulation (saos-2) and silencing (MG63). (c) apoptosis analysis by flow cytometry detected the apoptotic rate in saos-2 cells with circATRNL1 up-regulation and in MG63 with circATRNL1 silencing. (d) glucose uptake analysis and lactate production analysis uncovered glucose consumption and lactate generation with circATRNL1 up-regulation (saos-2) or silencing (MG63). (e) extracellular acidification rate (ECAR) analysis reflected the glycolytic capacity with circATRNL1 up-regulation (saos-2) or silencing (MG63). (f) in vivo mice assay indicated that the MG63 cells transfected with circATRNL1 knockdown could remarkably reduce the tumor growth in subcutaneous injection. tumor volume was calculated by detecting length and width. two-group comparison was calculated by student’s t-test. experiments were performed in triplicate. data are presented as mean ± SD. *p < 0.05, **p < 0.01
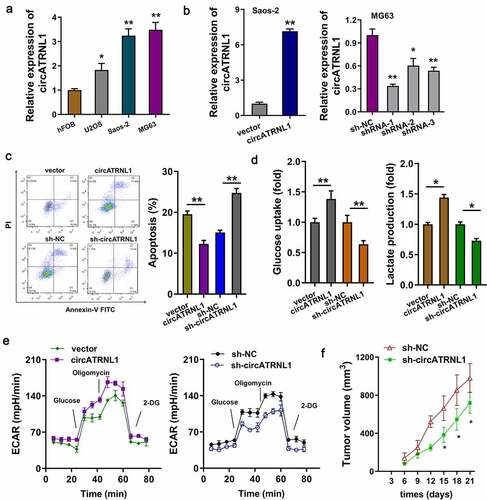
Figure 3. CircATRNL1 targeted miR-409-3p by miRNA sponge in osteosarcoma cells. (a) subcellular fractionation location analysis using RT-PCR revealed the circATRNL1 expression in the cytoplasm/nucleus portion of osteosarcoma cells (saos-2, MG63). (b) there were several complementary binding sites within miR-409-3p and circATRNL1. wild type and mutants were both constructed. (c) the co-location analysis by fluorescence in situ hybridization (FISH) illustrated the location of circATRNL1 and miR-409-3p in osteosarcoma cells (Saos-2). DAPI indicated the nucleus. (d) luciferase gene reporter assay indicated the activity in the co-transfection of miR-409-3p and circATRNL1 wild type/mutant. (e) RT-qPCR analysis detected the miR-409-3p expression level in circATRNL1 overexpression/silencing group. two-group comparison was calculated by student’s t-test. experiments were performed in triplicate. data are presented as mean ± SD. *p < 0.05, **p < 0.01
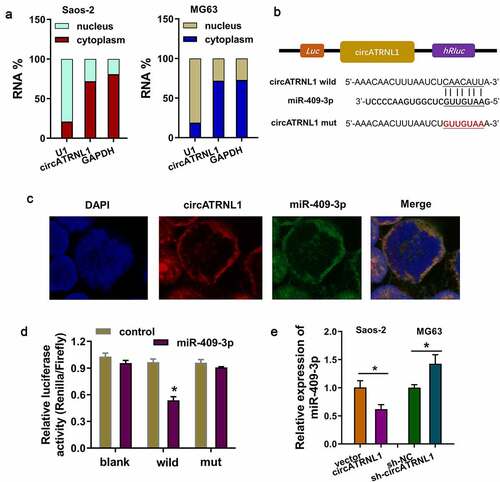
Figure 4. MiR-409-3p targeted LDHA axis in the osteosarcoma cells. (a) screening found that LDHA acted as the most promising target of miR-409-3p using the bioinformatics predictive manners (TARGETSCAN, miRanda, PITA). (b) mutation and wild type of LDHA were established for the luciferase assay. (c) luciferase gene reporter assay indicated the activity in the co-transfection of miR-409-3p and LDHA wild type. (d) RT-PCR illustrated the LDHA mRNA in Saos-2 cells transfected with circATRNL1 or/and miR-409-3p. (e) western blot analysis detected the LDHA protein levels in the saos-2 cells transfected with circATRNL1 or/and miR-409-3p. data are presented as mean ± SD. two-group comparison was calculated by student’s t-test. experiments were performed in triplicate. *p < 0.05, **p < 0.01
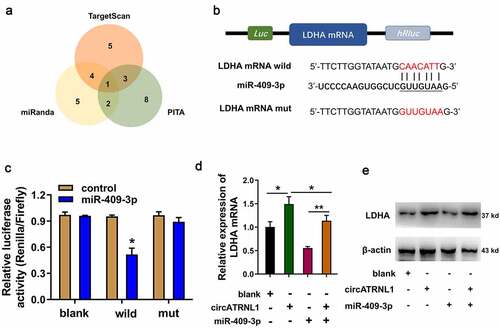
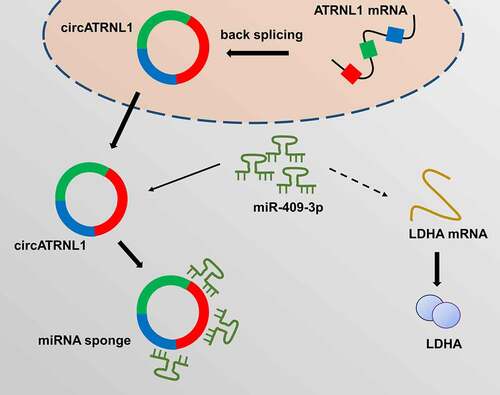
Figure 5. circATRNL1/miR-409-3p/LDHA axis promoted the osteosarcoma aerobic glycolysis
Supplemental Material
Download Zip (1.8 MB)Data availability statement
No research data shared.