
Figures & data
Figure 1. Study population and design. (a) Study groups were divided into pediatric and adult groups, and each group includes healthy controls and patients with ulcerative colitis. (b) Flow diagrams summarize the study process and enrichment analyses

Figure 2. DEGs between UC and healthy control. (a) DEGs in adults in Volcano plots. (b) DEGs in pediatrics in Volcano plots. Each symbol represents a gene, and gold or blue color indicates up-regulated or down-regulated genes, respectively. DEGs, Differentially expressed genes; UC, Ulcerative colitis
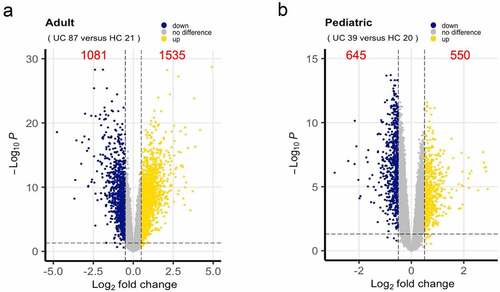
Figure 3. Enrichment analyses of overlapped DEGs in pediatric and adult UC. (a) Overlapped DEGs in pediatric and adult UC were shown in Venn diagram. (b) Top 20 KEGG pathways were enriched using overlapped up-regulated DEGs. (c) Top 20 KEGG pathways were enriched using overlappped down-regulated DEGs. The enriched analyses were ranked by p-value. DEGs, Differentially expressed genes; UC, Ulcerative colitis; KEGG, Kyoto Encyclopedia of Genes and Genomes
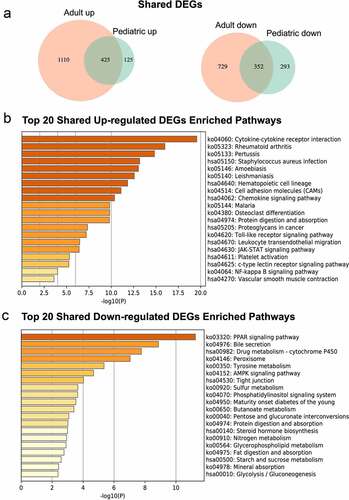
Table 1. Shared KEGG pathways enrichment analysis of GSVA
Figure 4. Shared gene sets between pediatric and adult UC using GSVA. (a) The differences in pathway enrichment between UC and healthy control in pediatric and adult were visualized by Volcano plot using GSVA. (b) Venn diagram of shared enrichment pathways in pediatric and adult UC. UC, Ulcerative colitis; GSVA, Gene Set Variation Analysis
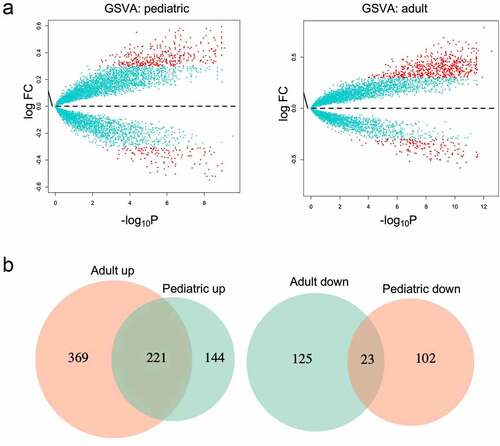
Table 2. Comparison of GSVA and metascape analysis
Figure 5. Expression of (a) HMGCS2, (b) EHHADH, (c) ACSM3, and (d) BDH2 mRNA in colonic mucosa of healthy patients and inflamed colonic mucosa of UC patients. Gene expression was normalized to GAPDH in each sample. *p < 0.05, ****p < 0.0001. UC, Ulcerative colitis
Figure 6. Butyrate inhibits intestinal inflammation in mice. (a) Mice were orally treated with C.rodentium (5 × 10⁸ CFU/mice) and treated with or without butyrate (200 mM) in drinking water for 10 days. Monitored mice weight every day. (b) Colonic histopathology was analyzed when mice were sacrificed on day 10. (c) Collected the feces and measured the CFU on day 4. (d) Mice were administrated with 2% DSS in drinking water for 7 days and switched to untreated water for another 3 days. Treated with or without butyrate (200 mM) in drinking water for 10 days, and mouse weights were monitored daily. (e) Histopathological change and histological score in of colon in mice colitis models. **p < 0.01. CFU, Colony forming unit; DSS, Dextran sulfate sodium
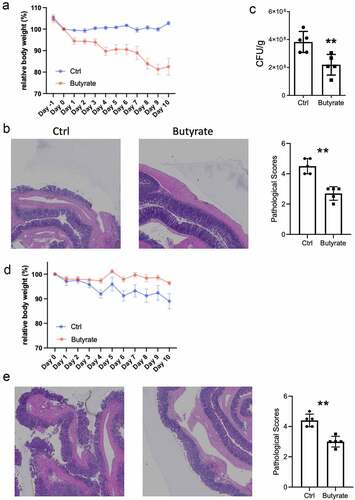
Figure 7. Expression of (a) HMGCS2, (b) EHHADH, (c) ACSM3, and (d) BDH2 mRNA in DSS-induced mice with or without butyrate. Gene expression was normalized to GAPDH in each sample. *p < 0.05. DSS, Dextran sulfate sodium
Supplemental Material
Download ()Availability of data and material
The datasets used and/or analyzed during this study are available from the corresponding author upon reasonable request.