
Figures & data
Table 1. Primer sequences used for qRT-PCR in this study
Figure 1. Clustering analysis of autophagy-related genes (ARGs) in patients with low-grade glioma (LGG). (a) Consensus clustering of LGG samples from The Cancer Genome Atlas (TCGA) dataset for k = 2 to 5. Optimal clustering is represented by k = 2. (b) Consensus clustering cumulative distribution function (CDF) for k = 2 to 9. (c) Relative change in area under CDF curve for k = 2 to 9. (d) Tracking plot for k = 2 to 9. (e) Principal component analysis of ARG mRNA expression profiles from patients with LGG. (f) Survival analysis in Clusters 1 and 2
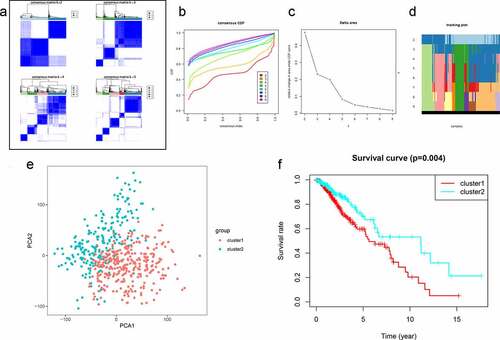
Figure 2. Differentially expressed autophagy-related genes (ARGs) in patients with and without low-grade glioma (LGG). (a) Venn diagram. (b) Heatmap. (c) Expression patterns. (d) Protein-protein interaction network. (e) Correlation
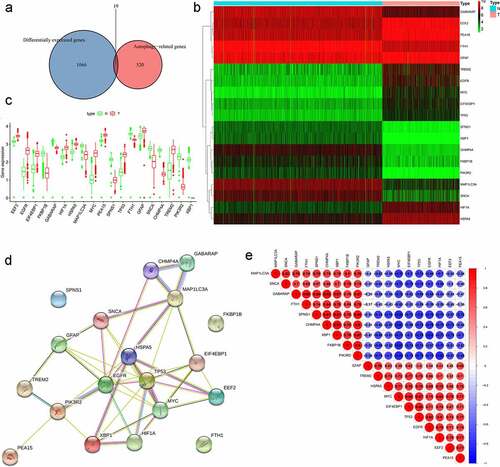
Figure 3.. GO term and KEGG pathway enrichment of differentially expressed autophagy-related genes (ARGs) in patients with and without low-grade glioma (LGG). (a) Enriched GO terms. (b) Enriched GO terms, with the x- and y-axes representing z-score and negative log P-value, respectively. (c) Enriched KEGG terms. (d) Enriched KEGG terms, with the x- and y-axes representing z-score and negative log P-value, respectively
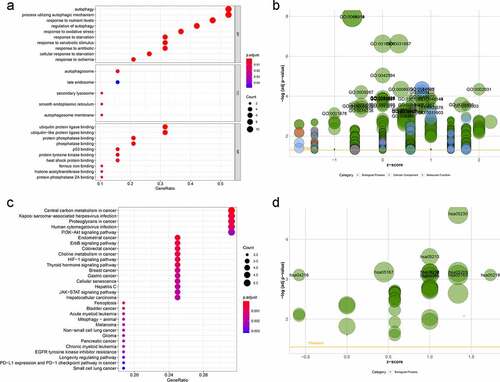
Figure 4. Construction of autophagy-related signature for patients with low-grade glioma (LGG). (a) Univariate analysis of differentially expressed autophagy-related genes (ARGs) to identify genes correlated with overall survival. (b) Kaplan-Meier curve for high- and low-risk patients. (c) Time-dependent ROC curve for 1-, 3-, and 5-year survival rates. (d) Distribution of risk scores in patients with LGG. (e) Scatterplots of patients with LGG and different survival statuses. (f) Expression of genes in high- and low-risk patients with LGG. (g) Univariate Cox regression analysis of clinicopathological parameters (including risk score) and patient survival. (h) Multivariate Cox regression analysis of clinicopathological parameters (including risk score) and patient survival
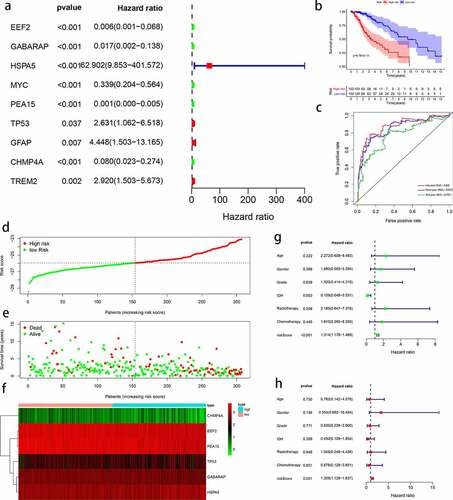
Figure 5. Evaluation of autophagy-related prognostic low-grade glioma (LGG) signature. Kaplan–Meier survival curves of autophagy-related signature in the testing cohort (a) and the entire TCGA cohort (b). Time-dependent ROC curve analysis of the testing cohort (c) and the entire TCGA cohort (d). Risk score distribution, survival status, and risk gene expression in the testing cohort (e) and entire TCGA cohort (f)
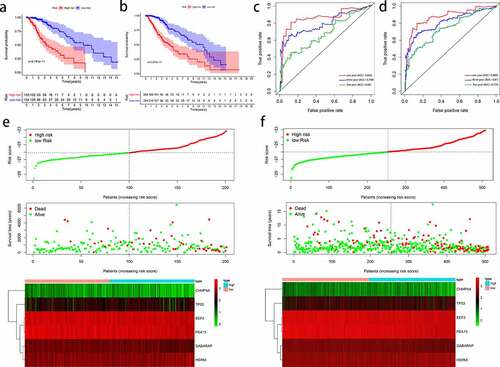
Figure 6. Outcome prediction of the autophagy-related signature in stratified patients with low-grade glioma (LGG). Survival analysis of prognostic LGG signature in patients stratified by age (≤ 40 and > 40), gender (female and male), grade (G2 and G3), IDH (mutant- and wild-type), radiotherapy (no and yes), and chemotherapy (no and yes)
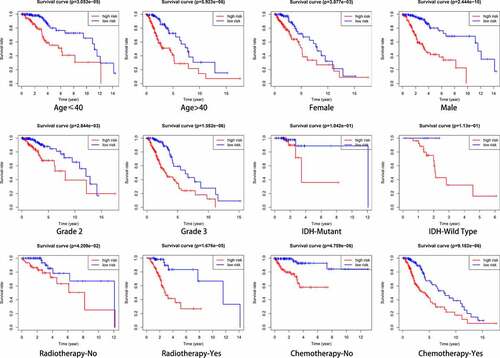
Figure 7. Relationship between clinical factors and the autophagy-related prognostic signature for low-grade glioma (LGG). (a) Expression of autophagy-related genes (ARGs) and distribution of clinicopathological features in high- and low-risk patients. (b-g) Effects of age, gender, grade, IDH, radiotherapy, and chemotherapy, respectively, on risk score distribution. *P < 0.05, **P < 0.01, ***P < 0.001, ****P < 0.0001, ns: no significant
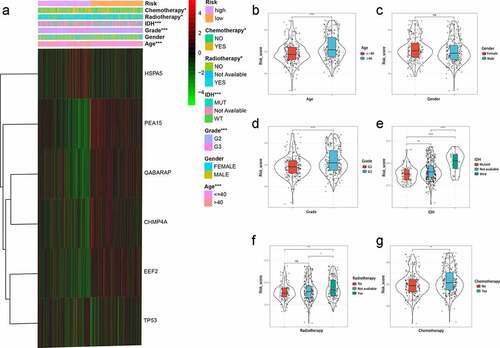
Figure 8. Significantly enriched KEGG pathways in The Cancer Genome Atlas (TCGA) cohort. Representative KEGG pathways in the high‐risk patients (a) and low-risk patients (b)
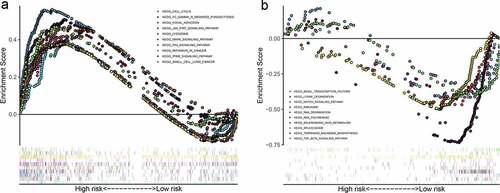
Figure 9. Overall survival analysis of signature-related autophagy-related genes (ARGs) in patients with and without in low-grade glioma (LGG). (a-f) EEF2, GAGBRAP, HSPA5, PEA15, TP53, and CHMP4A, respectively
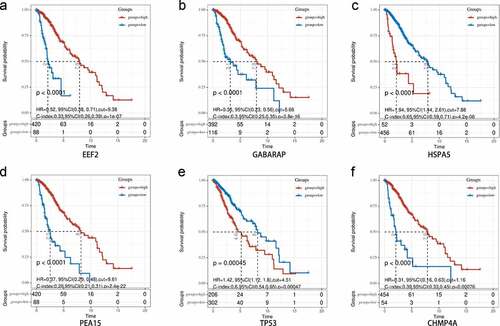
Figure 10. Immunohistochemistry of prognostic signature-related genes in patients with and without in low-grade glioma (LGG). (a-e) EEF2, HSPA5, PEA15, TP53, and CHMP4A, respectively
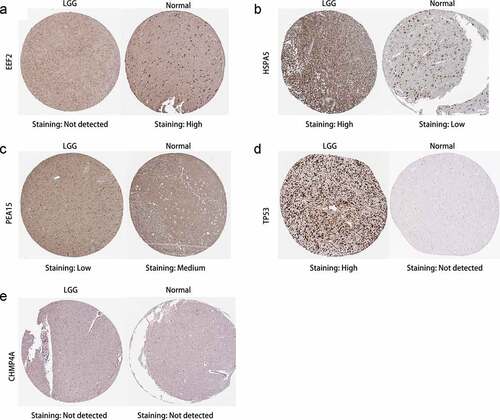
Figure 11. Differential expression of signature-related genes in patients with and without primary glioma. (a-f) EEF2, GAGBRAP, HSPA5, PEA15, TP53, and CHMP4A, respectively. *P < 0.05, **P < 0.01, ***P < 0.001, ****P < 0.0001
Supplemental Material
Download MS Word (2 MB)Availability of data and materials
Data associated with this manuscript can be made available from the corresponding authors on reasonable request.