Figures & data
Table 1. Primers information
Figure 1. Identification of 10 overlapping up-regulated DEGs in PAAD. (a-c) Heatmaps of top 20 DEGs of pancreatic adenocarcinoma compared with normal tissues in GSE15471(a), GSE16515(b) and GSE55643(c) datasets (up), the red represents high expression and the blue represents low expression. Volcano plots of DEGs of pancreatic cancer compared with normal tissues in GSE15471(a), GSE16515(b) and GSE55643(c) datasets (down), the red represents high expression and the green represents low expression. GSE15471 identified 708 up-regulated genes and 210 downregulated genes. GSE16515 identified 1984 up-regulated genes and 3869 downregulated genes. GSE55643 identified 59 up-regulated genes and 23 downregulated genes. (d) Venn diagram of the 10 overlapping DEGs of GSE15471, GSE16515 and GSE55643. (e) Heatmap of validation of the expression of 10 overlapping DEGs combined with TCGA-GTEx pancreatic cancer datasets. DEGs, differentially expressed genes; PAAD, pancreatic adenocarcinoma; TCGA, The Cancer Genome Atlas; GTEx, Genotype-Tissue Expression Project
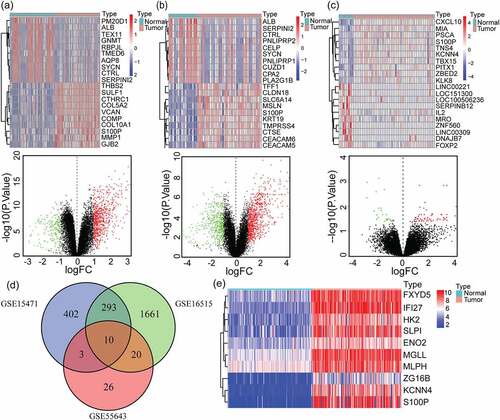
Figure 2. Identification and verification of IFI27 as a hub gene in PAAD. (a) The relationship between 10 overlapping DEGs expression levels and overall survival TCGA-PAAD. Only 4 genes (MGLL, HK2, KCNN4 and IFI27) with significant survival significance (p < 0.05) were displayed. (b) K-M plots of above 4 genes to verify the survival significance. (c) IFI27 was significantly up-regulated in PAAD compared with normal tissues. *p < 0.05 (left). The relationship between IFI27 expression levels and overall survival in PAAD analyzed by Kaplan-Meier Plotter (right). (d) mRNA levels of IFI27 were up-regulated in various kind of tumors compared with normal tissues (left). Box plot validating the expression of IFI27 in lacobuzio-Donahue Pancreas dataset based on the Oncomine database (right). (e) Correlations betweenIFI27 and clinical characteristics. *p < 0.05, **p < 0.01, ***p < 0.001. TCGA, The Cancer Genome Atlas; PAAD, pancreatic adenocarcinoma; DEGs, differentially expressed genes
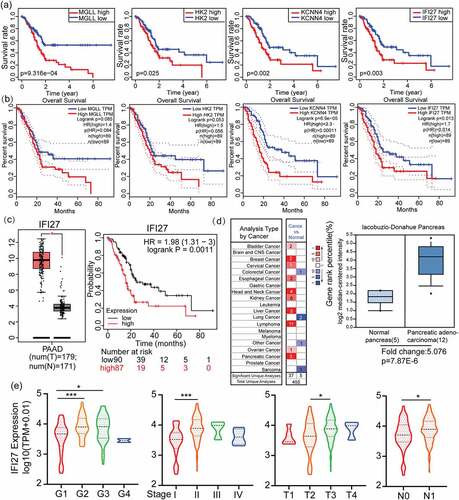
Figure 3. GSEA hallmark functional annotation of IFI27. (a) The top ten enriched pathways in PAAD samples with high expression of IFI27 were identified by GSEA. (b) Kaplan-Meier curves for glycolysis, myc targets v2 and mTORC1 signaling with higher IFI27 expression after filtered (p < 0.05). GSEA, Gene Set Enrichment Analysis; PAAD, pancreatic adenocarcinoma
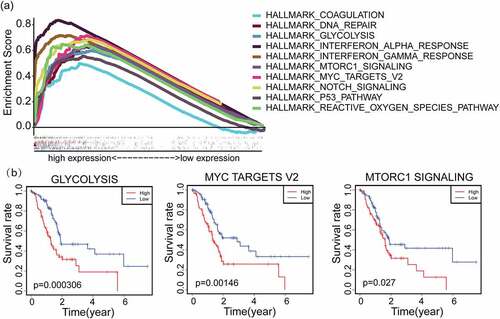
Figure 4. Tumor infiltrating immune cell analysis of IFI27. (a) Scatter plots showing the correlation of tumor infiltrating immune cells with IFI27 expression level generated by TIMER. (b) Wilcoxon rank sum test accurately compared the differences between the two groups, indicating that several immune cells in the high IFI27 group had significantly different infiltration density. (c) The relationship between the abundance ratios of ` 22 immune cells. The value represents the correlation value. Red represents a positive correlation, and the blue represents a negative correlation
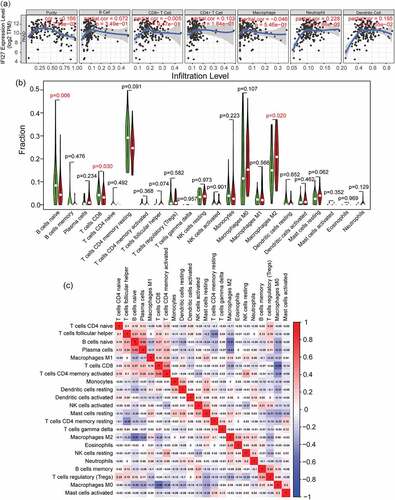
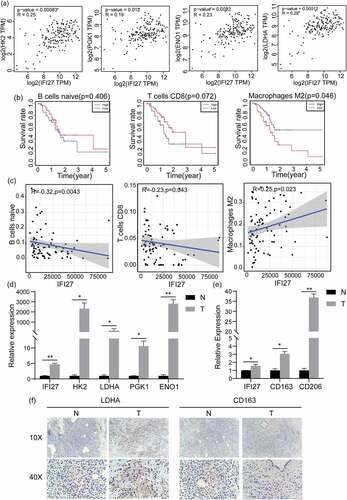
Figure 5. IFI27 is positively correlated with the expression of key genes in glycolysis and M2 macrophage markers. (a) Pearson’s correlation analysis of IFI27 and glycolysis-related genes in GEPIA2.0. (b) Survival analysis of infiltrated immune cells. (c) Scatterplots representing the relationships between the expression of IFI27 and infiltrated immune cells in TCGA. (d) mRNA expression levels of glycolysis-related genes in C57BL/6 mice pancreatic cancer and normal pancreatic tissues measured by qRT-PCR. (e) mRNA expression levels of M2 macrophage markers in pancreatic cancer and normal pancreatic tissues of C57BL/6 mice. (f) Immunohistochemical staining for LDHA (left) and CD163 (right) was performed in pancreatic cancer. *p < 0.05, **p < 0.01, ***p < 0.001. N, normal pancreatic tissues; T, pancreatic tumors; GEPIA, Gene Expression Profiling Interactive Analysis; TCGA, The Cancer Genome Atlas; qRT-PCR, quantitative real-time PCR