Figures & data
Table 1. NSCLC clinicopathological features and hsa_circ_0074027 levels
Figure 1. Hsa_circ_0074027 (HC0074027) levels are strongly correlated with NSCLC DTX-resistance. A. HC0074027 levels, via RT-qPCR, in sensitive and resistant tissues. B. HC0074027 levels, via RT-qPCR, in A549, H1299, A549/DTX, and H1299/DTX cells. C. The relationship between HC0074027 and overall survival of NSCLC patients. The IC50s of DTX (d), DDP (e), and PTX (f). The presented data are mean of 3 replicates, and *p < 0.05
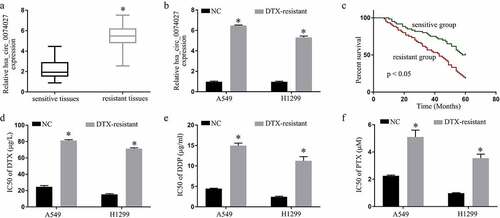
Figure 2. Hsa_circ_0074027 (HC0074027) downregulation inhibited chemoresistance in DTX-resistant NSCLC cells. A. HC0074027 quantification, via RT-qPCR, after silencing. IC50s of DTX (b), DDP (c), and PTX (d). The presented data are mean of 3 replicates, and *p < 0.05
Figure 3. Hsa_circ_0074027 (HC0074027) sequesters miR-379-5p activity. A. Predicted docking sites of HC0074027 and miR-379-5p. B. Direct binding between HC0074027 and miR-379-5p, as evidenced by the DLR assay. C. RIP assay validated the HC0074027 interaction with miR-379-5p. D. MiR-379-5p levels, via RT-qPCR, in A549, H1299, A549/DTX, and H1299/DTX cells. E. MiR-379-5p levels, via RT-qPCR?, in DTX-resistant cells incorporated with si-NC, or si-hsa_circ_0074027. F. MiR-379-5p levels, via RT-qPCR, in sensitive and resistant tissues. G. Association between HC0074027 and miR-379-5p, as evidenced by the Spearman’s correlation coefficient. H. MiR-379-5p levels, via RT-qPCR, in DTX-resistant cells incorporated with NC-, or miR-379-5p-inhibitor. IC50s of DTX (i), DDP (j), and PTX (k). The presented data are mean of 3 replicates, and *p < 0.05
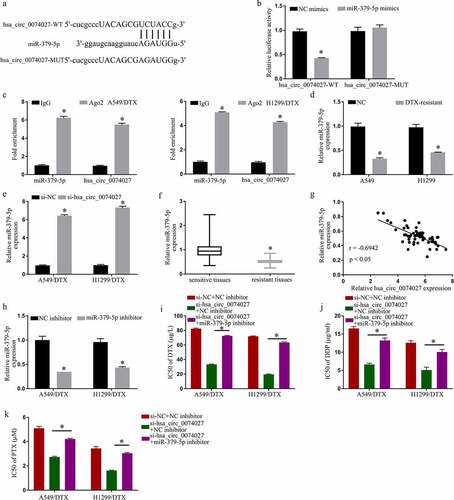
Figure 4. MiR-379-5p binds IGF1 and inhibits chemoresistance in DTX-resistant NSCLC cells. A. Predicted docking sites of IGF1 and miR-379-5p. B. IGF1 and miR-379-5p interaction validation, via DLR assay. IGF1 levels, via RT-qPCR (c) and Elisa assay (d). IGF1 levels, via RT-qPCR (e) and Elisa assay (f) in A549, H1299, A549/DTX, and H1299/DTX cells. G. IGF1 levels, via RT-qPCR, in sensitive and resistant tissues. H. IGF1 and miR-379-5p relationship, via the Spearman’s correlation coefficient. IGF1 levels, via RT-qPCR (i) and Elisa assay (j). IC50s of DTX (k), DDP (l), and PTX (m). IGF1 levels, via RT-qPCR (n) and Elisa assay (o). P. HC0074027 and IGF1 relationship, via the Spearman’s correlation coefficient. The presented data are mean of 3 replicates, and *p < 0.05
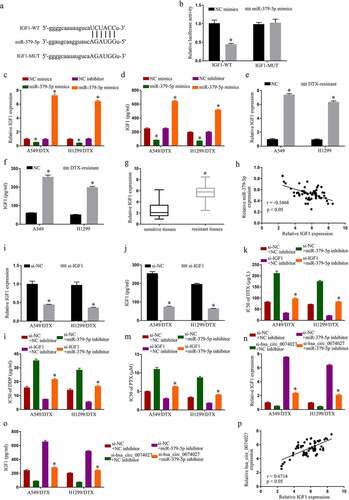
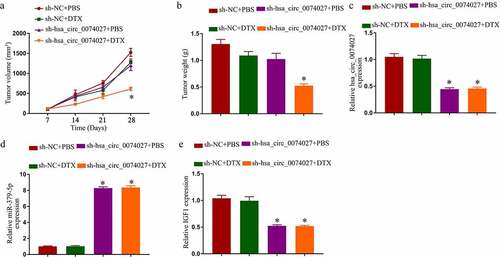
Figure 5. Hsa_circ_0074027 (HC0074027) downregulation induced DTX sensitivity in vivo. Tumor volume (a) and weight (b). HC0074027 (c), miR-379-5p (d), and IGF1 (e) levels, via RT-qPCR, in murine tumor tissues. The presented data are mean of 3 replicates, and *p < 0.05