Figures & data
Table 1. The primer sequences
Figure 1. The expression of ORM1 is upregulated in breast cancer a IHC staining of the tissues derived from the patients. b The expression level of ORM1 mRNA in the breast cancer patients’ tissues and the adjacent normal tissues. Data are presented as mean ± SEM from three independent experiments, n = 10, respectively. **** P < 0.0001. c The expression of ORM1 was reanalyzed from the previously published dataset GSE58812. d The expression level of ORM1 mRNA in the normal breast cell line HBL-100 and the breast cancer cell lines. Data are presented as mean ± SEM from three independent experiments. ** P < 0.01; **** P < 0.0001, compared with the HBL-100 cell line
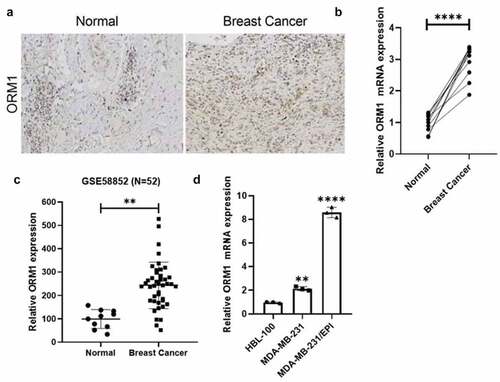
Figure 2. ORM1 promote the proliferation, migration and epirubicin resistance of breast cancer cells a Colony formation assay was performed to detect the proliferation of the cell lines, scale bar: 5 μm. b Transwell assay was performed to detect the migration of the cell lines, scale bar: 50 μm. c CCK-8 assay was performed to analyze the epirubicin IC50 values of the cell lines. d Data are presented as mean ± SEM from three independent experiments. *** P < 0.001; **** P < 0.0001, compared with the HBL-100 cell line
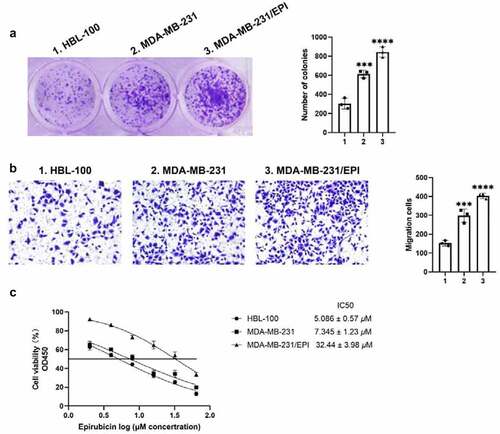
Figure 3. Downregulation of ORM1 suppressed the malignant phenotype of breast cancer cells a qRT-PCR assay was performed to detect the transfection efficiency on si-ORM1; b Colony formation was performed to detect the proliferation after downregulating ORM1, scale bar: 5 μm; c Wound healing assay was performed to detect the migration at different time after downregulating ORM1; d Flow cytometry was performed to detect the apoptosis of cells treating with epirubicin after downregulating ORM1
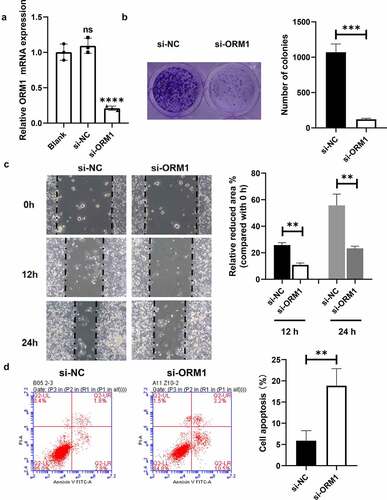
Figure 4. ORM1 suppressed the migration of breast cancer cells via targeting MMP-2 and MMP-9 a -PCR assay and western blot were performed to detect the mRNA expression of MMP-2 and MMP-9 after downregulating ORM1; b Western blot was performed to detect the expression of MMP-2 and MMP-9 after upregulating MMP-2 or MMP-9; c Transwell assay was performed to detect the migration after upregulating MMP-2 and MMP-9, respectively
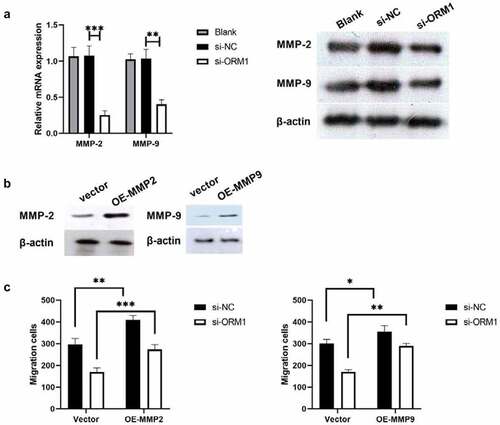
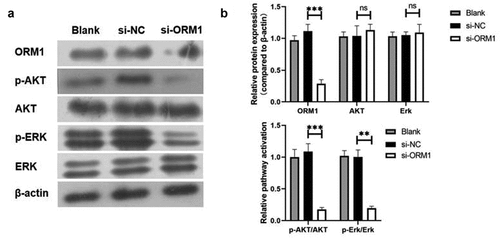
Figure 5. ORM1 could upregulate the MMP-2 and MMP-9 then activate the AKT/Erk signaling pathways A-B. Western blot assay was performed to detect the level of ORM1, p-AKT, AKT, p-Erk and Erk