
Figures & data
Figure 1. Testing of spatial learning and memory in the AD+TG, AD+donepezil, AD model and Normal control groups by Morris water maze. (a) The swimming trajectory of mice in the Normal control group; (b) The swimming trajectory of mice in the AD model group; (c) The swimming trajectory of mice in the AD+donepezil group; (d) The swimming trajectory of mice in the AD+TG group; (e) Significant difference of escape latency in the AD+TG group than that in the AD model group was detected (** p < 0.05). (f) Significant more frequency of crossing the target platform in AD+TG group than that in the AD model group was detected (** p < 0.05). Data was expressed as the mean ± standard error of the mean (SEM). (n = 8/group in the AD+TG group; n = 8/group in the AD+donepezil group; n = 8/group in the AD model group; n = 8/group in the Normal control group). ‘**’ indicating significant inter-group difference. TG: Tripterygium glycoside; AD: Alzheimer disease; NS: normal saline
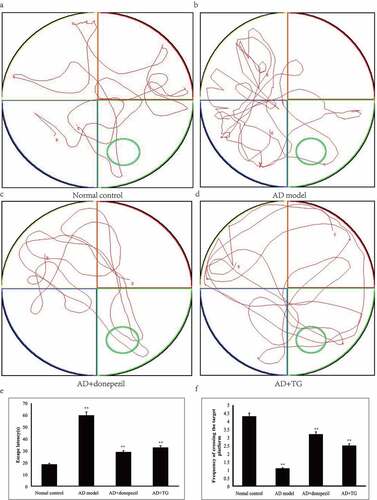
Figure 2. The distribution of Aβ, p-Tau and CD11b immunolabeling across the brains in the AD+TG, AD+donepezil, AD model and Normal control groups. (a–e): The distribution of Aβ immunolabeling in the AD+TG, AD+donepezil, AD model and Normal control groups. (f–j): The distribution of p-Tau immunolabeling in the AD+TG, AD+donepezil, AD model and Normal control groups. (k–o): The distribution of CD11b immunolabeling in the AD+TG, AD+donepezil, AD model and Normal control groups. Data was expressed as the mean ± standard error of the mean (SEM). (n = 8/group in the AD+TG group; n = 8/group in the AD+donepezil group; n = 8/group in the AD model group; n = 8/group in the Normal control group). ‘**’ indicating significant inter-group difference. TG: Tripterygium glycoside; AD: Alzheimer disease; NS: normal saline
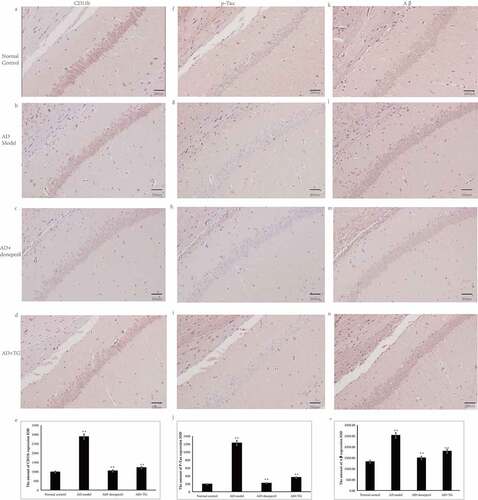
Figure 3. The results of Nissl staining. (a) Nissl staining in the Normal control group. (b) Nissl staining in the AD model group. (c) Nissl staining in the AD+donepezil group. (d) Nissl staining in the AD+TG group. (e) The comparison of the number of pyramidal neurons in the AD+TG, AD+donepezil, AD model and Normal control groups. Data was expressed as the mean ± standard error of the mean (SEM). (n = 8/group in the AD+TG group; n = 8/group in the AD+donepezil group; n = 8/group in the AD model group; n = 8/group in the Normal control group). ‘**’ indicating significant inter-group difference. TG: Tripterygium glycoside; AD: Alzheimer disease; NS: normal saline
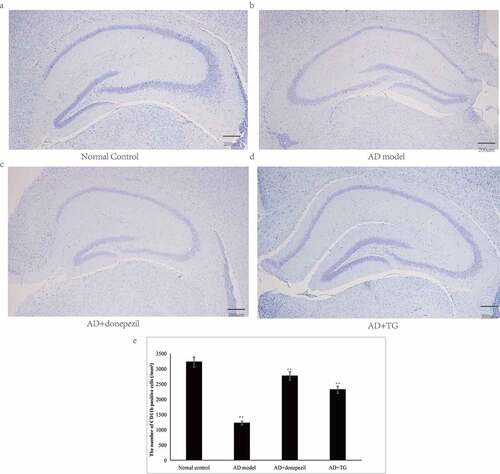
Figure 4. The expression levels of p-P38, P38, p-IκBα, Caspase1, COX2, and iNOS proteins between groups. Quantitative summaries of the protein levels relative to α-tubulin as an internal control, expressed as a percentage of α-tubulin optical density (o.d.) for the groups (n = 8/group). Statistical results (Kruskal–Wallis nonparametric test with Dunn’s multiple post hoc comparison) were shown in the bar graphs, with ‘**’ indicating significant inter-group difference. Data was expressed as the mean ± standard error of the mean (SEM)(n = 8/group). (a–g) The expression levels of p-P38, P38, p-IκBα, Caspase1, COX2, and iNOS proteins in AD+TG, AD+donepezil, AD mice model and Normal control groups. (a) p-P38; (b) P38; (c) p-IκBα; (d) Caspase1; (e) COX2; (f) iNOS. (g) The western blotting results of p-P38, P38, p-IκBα, Caspase1, COX2, and iNOS proteins. (h–n) The expression levels of p-P38, P38, p-IκBα, Caspase1, COX2, and iNOS proteins in AD+TG, AD cell model and Normal control groups. (h) p-P38; (i) P38; (j) p-IκBα; (k) Caspase1; (l) COX2; (m) iNOS. (n) The western blotting results of p-P38, P38, p-IκBα, Caspase1, COX2, and iNOS proteins. ‘**’ indicating significant inter-group difference. TG: Tripterygium glycoside; AD: Alzheimer disease; NS: normal saline
Figure 5. The expression levels of IL-1β, TNF-α, COX2, and iNOS mRNAs between groups. (a) The expression levels of IL-1β, TNF-α, COX2, and iNOS mRNAs in brain tissues in the AD+TG, AD+donepezil, AD model and Normal control groups. (b) The expression levels of IL-1β, TNF-α, COX2, and iNOS mRNAs in the AD+TG, AD cell model and Normal control groups. Data was expressed as the mean ± standard error of the mean (SEM)(n = 8/group). ‘**’ indicating significant inter-group difference. TG: Tripterygium glycoside; AD: Alzheimer disease; NS: normal saline
Figure 6. The expression levels of IL-1β, TNF-α and release of NO between groups. A: The expression levels of IL-1β, TNF-α and release of NO in the AD+TG, AD+donepezil, AD model and Normal control groups. (a) IL-1β; (b) TNF-α; (c) Nitrite. B: The expression levels of IL-1β, TNF-α and release of NO in the AD+TG, AD cell model and Normal control groups. (d) IL-1β; (e) TNF-α; (f) Nitrite.Data was expressed as the mean ± standard error of the mean (SEM)(n = 8/group). ‘**’ indicating significant inter-group difference. TG: Tripterygium glycoside; AD: Alzheimer disease; NS: normal saline
Availability of data and material
All data, models, and code generated or used during the study appear in the submitted article.