Figures & data
Figure 1. Effects of UTI on body weight and lung tissue W/D of LPS-induced rats. *Compared with control group, P < 0.05; #compared with model group, P < 0.05.
Figure 2. Effects of UTI on numbers of neutrophils and total cells in BALF of LPS-induced rats. *Compared with control group, P < 0.05; #compared with model group, P < 0.05.
Figure 3. Effects of UTI on pathological injury of lung tissue in LPS-induced rats. Magnification: 100 × . A: Control group, normal alveoli (asterisk) and alveolar septa (black arrow) with few neutrophils are shown; B: model group, with thickened septum (asterisk), alveolar bleeding (black arrow) as well as considerable cell infiltration and alveolar fibrin deposition (yellow arrow); C: DXM group, with significantly alleviated cell infiltration and alveolar fibrin deposition; D: UTI group, with significantly alleviated cell infiltration and alveolar fibrin deposition.
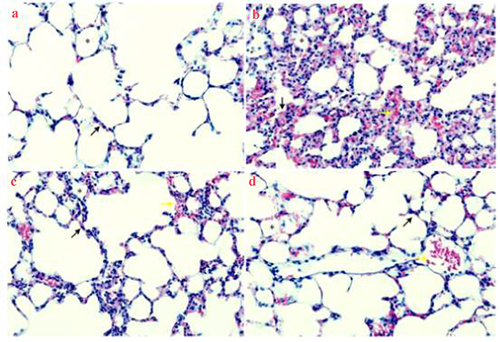
Table 1. HE staining scores.
Figure 4. Effects of UTI on pulmonary vascular endothelial permeability of LPS-induced rats. A: Control group; B: model group; C: DXM group; D: UTI group. *Compared with control group, P < 0.05; #compared with model group, P < 0.05.
Figure 5. Effects of UTI on levels of IL-1β, IL-6 and TNF-α in BALF of LPS-induced rats. *Compared with control group, P < 0.05; #compared with model group, P < 0.05.
Figure 6. Effects of UTI on protein expressions of TLR4, MyD88 and NF-κB in lung tissue of LPS-induced rats. *Compared with control group, P < 0.05; #compared with model group, P < 0.05.