
Figures & data
Table 1. Clinical information of patients was included in this study
Table 2. Differentially expressed proteins between oral carcinoma in situ and healthy control
Table 3. Differentially expressed proteins between OSCC and healthy control
Figure 1. Differentially expressed proteins in oral carcinoma in situ and OSCC. (a) Scatter plots of differentially expressed proteins between the oral carcinoma in situ group and the healthy control group. Red and Blue color indicated up- and down-regulation, respectively. (b) Scatter plots of differentially expressed proteins between the OSCC and the healthy control group. Red and Blue color indicated up- and down-regulation, respectively. (c) Comparison of the mean values of the significantly changed proteins between the cancer group and control normal group. The x-axis shows healthy control and cancer groups and y-axis shows mean values
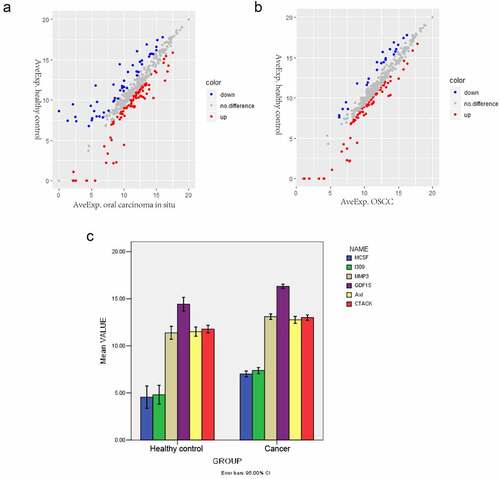
Table 4. Correlation analysis between GDF15 and differentially expressed proteins
Table 5. The results of diagnostic efficiency analysis
Figure 2. ROC curve analyses. The x-axis indicated specificity and y-axis indicated sensitivity. (a) GDF15. (b) MCSF. (c) I309. (d) MMP3. (f) CTACK. (e) AXL. (g) The combination of these six proteins
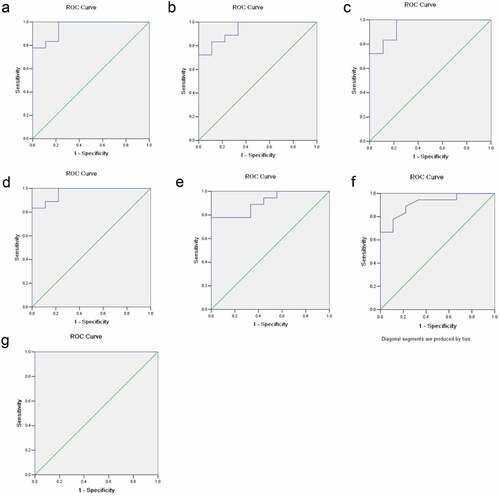
Figure 3. Kaplan-Meier analysis in TCGA dataset. (a) Risk score distribution, survival overview, and hierarchical clustering for OSCC patients in TCGA cohort. (b) The overall survival curves of the GDF15 high expression and low expression groups in TCGA cohort
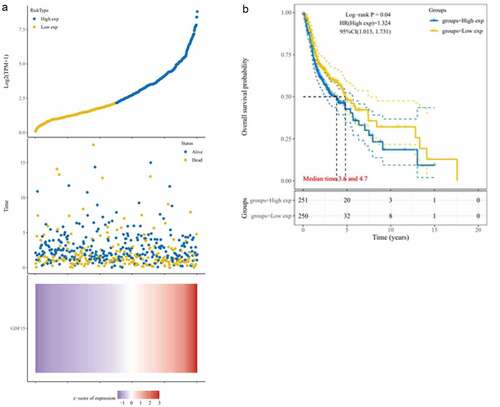
Figure 4. Correlation analysis in TCGA dataset. (a) MMP3. (b) AXL. (c) MCSF. (d) I309. (e) CTACK. The X axis represents the expression distribution of GDF15, and the Y axis ordinate represents the expression distribution of MMP3, AXL, MCSF (CSF), I309 and CTACK, respectively. The density curve on the upper side is the distribution trend of GDF15, and the density curve on the right represents the distribution trend of MMP3, AXL, MCSF (CSF), I309 (CCL1) and CTACK (CCL27), respectively. (f) Correlation analysis between each gene and GDF15. Red represents a positive correlation, blue represents a negative correlation, the darker the color is, the stronger the correlation between the two, *P < 0.05, **P < 0.01
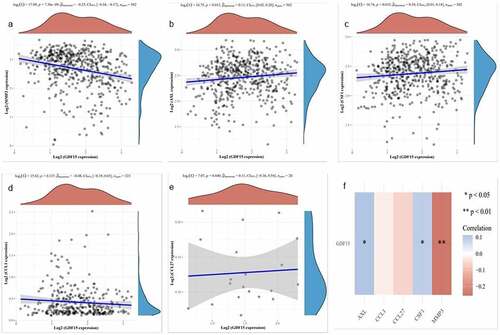
Table 6. The mean optical density of the immunohistochemical staining of cells
Figure 5. Immunofluorescence staining of key proteins in HSC-3 and HaCaT cells. The cytoplasm of HSC-3 cells was stained with green fluorescence, and the cytoplasm of HaCaT cells was stained with red fluorescence. The nuclei were stained blue with DAPI
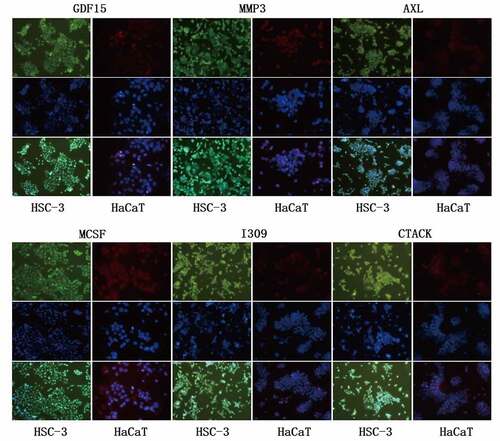
Figure 6. Immunohistochemical analysis of key proteins in HSC-3 and HaCaT cells
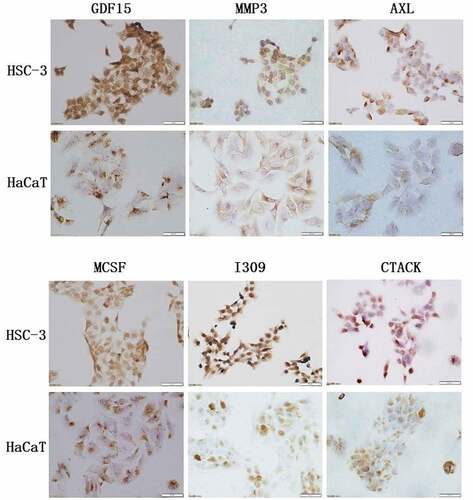
Figure 7. Western blot of key proteins in HSC-3 and HaCaT cells. The expression level of GDF15, MCSF, I309, MMP3, CTACK and AXL was detected by western blotting and its quantification in HSC-3 and HaCaT cells
Table 7. The mean optical density of the immunohistochemical staining of tissues
Figure 8. In vivo tumorigenesis assay and histological evaluation. (a) In vivo tumorigenesis assay: (a) Tumor formation of nude mouse in experimental group. (b) The general view of tissue sampling in nude mouse. (c) The general view of tissue sampling in control group. (B) Histological evaluation: (a) HE staining of OSCC tumor tissues in nude mouse. (b) HE staining of normal tissues in control group. (n = 6)
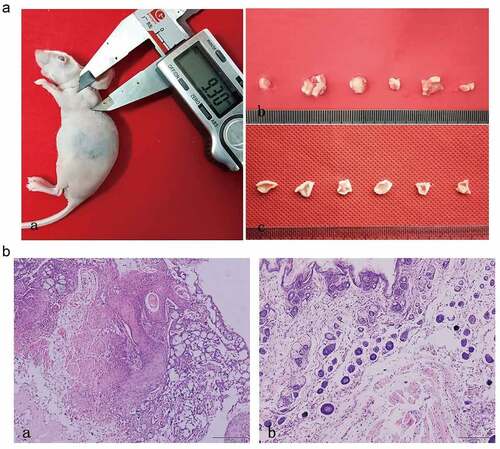
Figure 9. Immunohistochemical analysis of key proteins in OSCC nude mouse
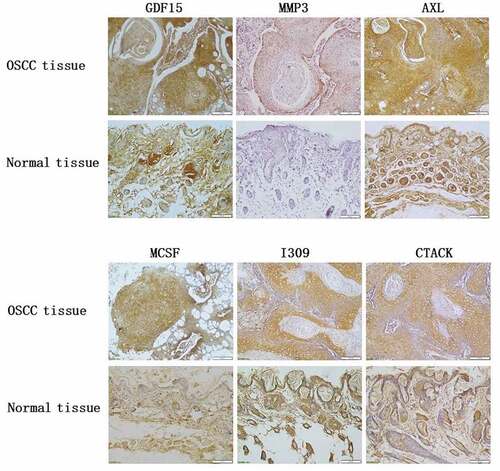
Figure 10. Western blot of key proteins in OSCC nude mouse. The expression level of GDF15, MCSF, I309, MMP3, CTACK and AXL was detected by western blotting and its quantification in OSCC nude mouse tumor tissue and normal tissue
Data availability statement
The data used and analyzed during the current study available from the corresponding author on reasonable request.