
Figures & data
Figure 1. Captopril reduced HSC-T6 cells viability. (a) After HSC-T6 cell was exposed to glucose of different concentration for 48 h, cell viability was detected through CCK8 assay. (b) CCK8 assay. (c) CCK8 assay. *p < 0.05, **p < 0.01, *** p < 0.001
Figure 2. Captopril reduced oxidative stress, inflammation and fibrosis in HG-treated HSC-T6. (a) The evaluation of SOD and MDA levels through related kit. (b) ROS staining results. (c) The levels of liver fibrosis-related proteins were detected through Western blot. FN: fibronectin, CO-I: collagen I, CO-III: collagen III, CO-IV: collagen IV. *** p < 0.001 Vs Control. ###p < 0.001 Vs HG
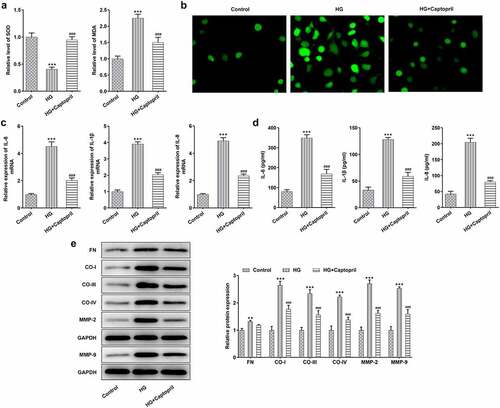
Figure3 The detection of NF-kβ and wnt3a/β-catenin pathway in HG-induced HSC-T6 cells. *** p < 0.001 Vs Control. ##p < 0.01, ###p < 0.001 Vs HG
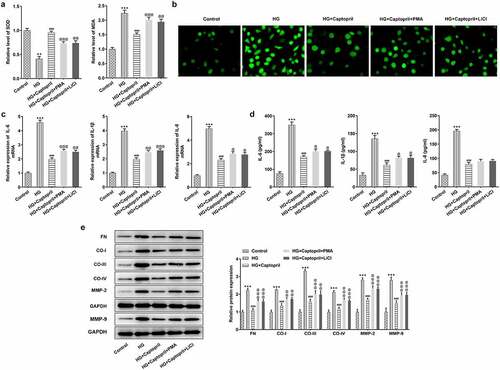
Figure 4. PMA or LiCl treatment reversed the effects of captopril in oxidative stress, inflammatory response, and fibrosis. (a) The detection of SOD and MDA levels by related kits. (b) SOD staining. (c) The analysis of inflammatory factors through qPCR. (d) The detection of inflammatory factors levels by Western blotting. (e) The evaluation of liver fibrosis-related markers by Western blot assay. FN: fibronectin, CO-I: collagen I, CO-III: collagen III, CO-IV: collagen IV. **p < 0.01, *** p < 0.001 Vs Control. @ p < 0.05, @@ p < 0.01, @@@ p < 0.001 Vs HG+Captopril
Data availability statement
The datasets used and/or analyzed during the current study are available from the corresponding author or first author on reasonable request.