
Figures & data
Table 1. Clinical baseline characteristics of patients with OS
Table 2. Primer sequences for RT-qPCR
Figure 1. Poor miR-15a expression indicates an unfavorable survival rate in patients with OS. a, a heatmap for differentially expressed miRNAs between OS and normal samples in GEO GSE70367 and GSE65071 datasets; b, Venn diagrams for the intersections of the differentially expressed miRNAs obtained from two datasets; c, miR-15a expression in OS and normal tissues predicted on the TCGA database (p < 0.05, unpaired t test); d, the relevance between miR-15a and survival rate of patients predicted on the TCGA database (p < 0.05, Kaplan-Meier analysis); e, miR-15a expression in the collected tumor tissues and paired normal ones from patients determined by RT-qPCR (n = 31, p < 0.05, paired t test); f, relevance between miR-15a expression and the survival rate of patients (p < 0.05, Kaplan-Meier analysis). Repetition = 3
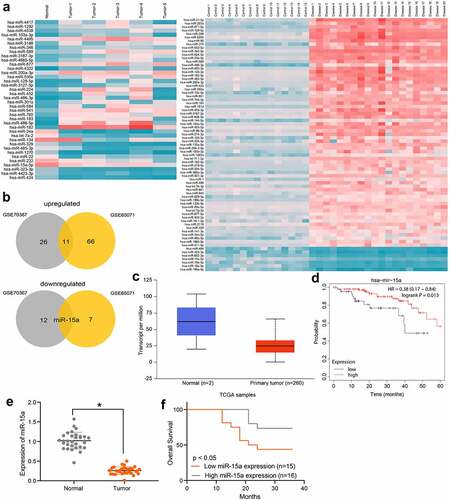
Figure 2. miR-15a suppresses viability of OS cells. a, miR-15a expression in OS cell lines (HOS, SaOS-2, MG-63 and U2-OS) and in normal osteoblast cells hFOB1.19 determined by RT-qPCR (*p < 0.05, one-way ANOVA); b, transfection efficacy of miR-15a mimic and miR-15a inhibitor in MG-63 and U2-OS cells, respectively, determined by RT-qPCR (*p < 0.05, unpaired t test); c, viability of cells determined by colony formation assay (*p < 0.05, one-way ANOVA); D-E, migration and invasion abilities of cells determined by wound-healing (d) and Transwell assay (e), respectively (*p < 0.05, one-way ANOVA); f, volume of the xenograft tumors in nude mice (*p < 0.05, two-way ANOVA); g, weight of the xenograft tumors in nude mice (*p < 0.05, one-way ANOVA). n = 6 in each group; Repetition = 3
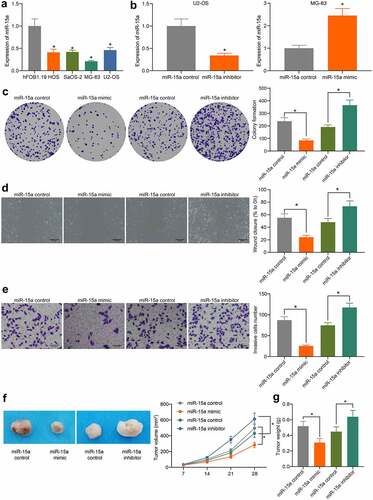
Figure 3. miR-15a promotes apoptosis and cell cycle arrests of OS cells. a, a GO biological enrichment analysis based on the predicted target mRNAs of miR-15a; b, apoptosis of MG-63 and U2-OS cells determined by flow cytometry (*p < 0.05, one-way ANOVA); c, protein levels of Bcl-2 and Bax in cells determined by western blot analysis (*p < 0.05, two-way ANOVA); d, cell cycle progression in cells determined by flow cytometry (*p < 0.05, two-way ANOVA); E, protein levels of CDK2, CDK4, cyclin D, cyclin E in cells determined by western blot analysis (*p < 0.05, two-way ANOVA). Repetition = 3
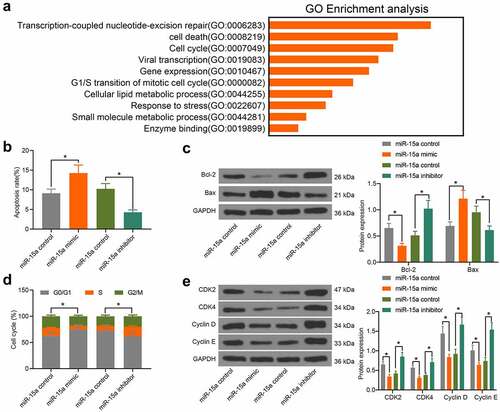
Figure 4. miR-15a from serum-derived exosomes can be internalized by OS cells. a, existence of miR-15a in exosomes predicted using the EVmiRNA system; b, diameter of the extracted particles evaluated by NTA; c, protein levels of TSG101 and CD81 in the particles determined by RT-qPCR; d, morphology of the particles observed under a TEM; e, miR-15a in extracted exosomes examined by RT-qPCR; f, internalization of the exosomes by OS cells confirmed by fluorescence tracking; g, miR-15a expression in OS cells after serum-derived exosome treatment determined by RT-qPCR (*p < 0.05, two-way ANOVA)
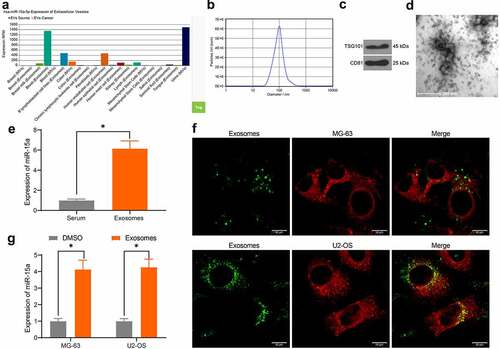
Figure 5. miR-15a directly binds to GATA2. a, a KEGG pathway enrichment analysis based on the predicted target mRNAs of miR-15a; b, a heatmap for differentially expressed mRNAs between normal and OS samples on the GEO GSE32395 dataset; c, a Venn diagram for the intersection of predicted mRNAs of miR-15a and the screened out differentially expressed mRNAs; d, binding relationship between miR-15a and GATA2 validated through a dual luciferase reporter gene assay (*p < 0.05, two-way ANOVA); E, GATA2 expression in OS cell lines and hFOB1.19 cells determined by RT-qPCR (*p < 0.05, one-way ANOVA); F, GATA2 expression in MG-63 and US-OS after miR-15a alteration determined by RT-qPCR (*p < 0.05, one-way ANOVA). Repetition = 3
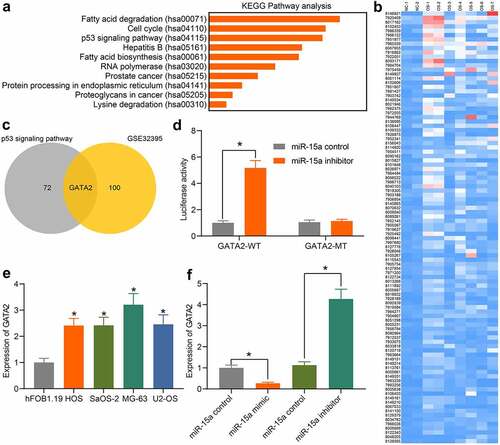
Figure 6. GATA2 may serve as a prognostic marker indicating poor prognosis in patients. a, GATA2 expression in OS and normal tissues predicted on TCGA database (p < 0.05, unpaired t test); b, the relevance between GATA2 and survival rate of patients predicted on TCGA database (p < 0.05, Kaplan-Meier analysis); c, mRNA expression of GATA2 in the collected tumor tissues and paired normal ones from patients determined by RT-qPCR (n = 31, p < 0.05, paired t test); d, relevance between GATA2 expression and the survival rate of patients (p < 0.05, Kaplan-Meier analysis). e, a negative correlation between GATA2 and miR-15a expression in the OS tumors (*p < 0.01, r = −0.804, Pearson’s correlation analysis). Repetition = 3
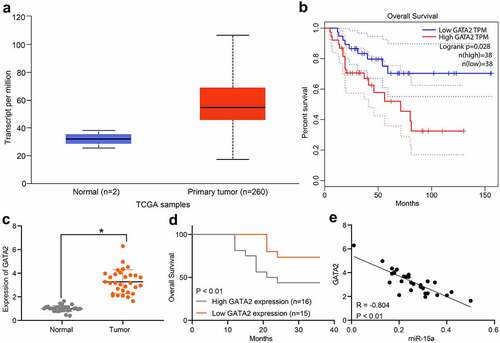
Figure 7. GATA2 mediates transcription activity of MDM2 to suppress the p53 signaling pathway. a, putative binding sites between GATA2 and the promoter region of MDM2 predicted on the UCSC website; b, binding relationship between GATA2 and MDM2 validated through the ChIP assay (*p < 0.05, two-way ANOVA); c, MDM2 expression in OS samples predicted on TCGA database (*p < 0.05, unpaired t test); d, relevance between MDM2 and prognosis of OS patients predicted on TCGA database (*p < 0.05, Kaplan-Meier analysis); e, a negative correlation between the predicted GATA2 and MDM2 expression in OS samples (*p < 0.05, Pearson’s correlation analysis); f, MDM2 expression in tumor and normal tissues from OS patients determined by RT-qPCR (n = 31, *p < 0.05, paired t test); g, relevance between MDM2 expression and the survival rate of the OS patients (*p < 0.05 according to the Kaplan-Meier analysis); h, a positive relevance between GATA2 and MDM2 expression in the tumor tissues from patients (*p < 0.05, Pearson’s correlation analysis); i, MDM2 expression in OS cell lines and in hFOB1.19 cells determined by RT-qPCR (*p < 0.05, one-way ANOVA); j, mRNA expression of MDM2 in cells transfected with MDM2-OE examined by RT-qPCR (*p < 0.05, one-way ANOVA); k, protein level of p53 in MG-63 cells after different treatment detected by western blot analysis (*p < 0.05, one-way ANOVA). Repetition = 3
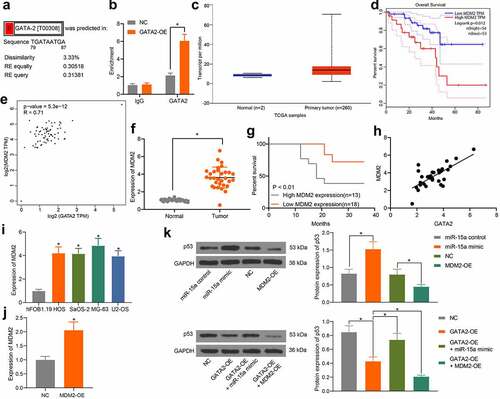
Figure 8. miR-15a promotes apoptosis and cell cycle arrests of OS cells. a, transfection efficiency of GATA2-OE, miR-15a mimic and MDM2-OE in MG-63 cells evaluated by RT-qPCR (*p < 0.05, one-way ANOVA); b, proliferation of cells determined by the colony formation assay (*p < 0.05, one-way ANOVA); c, apoptosis of MG-63 and U2-OS cells determined by flow cytometry (*p < 0.05, one-way ANOVA); d, protein levels of Bcl-2 and Bax in cells determined by western blot analysis (*p < 0.05, two-way ANOVA); e, cell cycle progression in cells determined by flow cytometry (*p < 0.05, two-way ANOVA); f, protein levels of CDK2, CDK4, cyclin D, cyclin E in cells determined by western blot analysis (*p < 0.05, two-way ANOVA). Repetition = 3
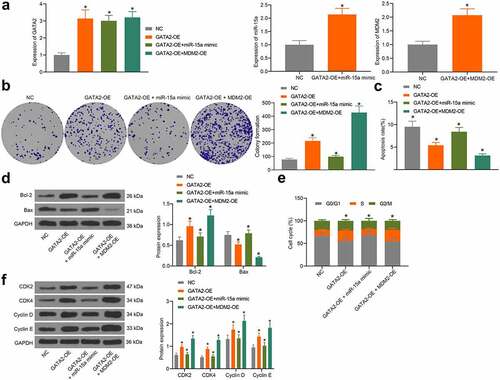
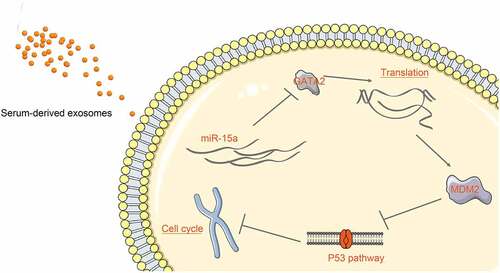
Figure 9. A diagram representation of the molecular mechanism. In OS cells, miR-15a directly binds to GATA2 mRNA, whereas GATA2 promotes MDM2 transcription and suppresses the activity of the p53 signaling pathway. miR-15a suppresses while the GATA2/MDM2 axis promotes proliferation and cell cycle progression of cells. miR-15a is one of the cargos of the serum-derived exosomes and can be delivered to the cells by the exosomes
Availability of data and materials
The analyzed data sets generated during the present study areavailable from the corresponding author on reasonable request.