1,093
Views
7
CrossRef citations to date
0
Altmetric
research paper

Downregulation of long non-coding RNA PVT1 enhances fracture healing via regulating microRNA-497-5p/HMGA2 axis

, , & ORCID Icon
Pages 8125-8134 | Received 04 Aug 2021, Accepted 24 Sep 2021, Published online: 20 Oct 2021

Figures & data

Figure 1. Serum samples were also collected from 80 fragility fracture patients at 7, 14, 21 days after standardized fixation therapy. Levels of lncRNA PVT1 (a) and miR-497-5p (b) were detected at different time points. *** P < 0.001, compared with healthy individuals
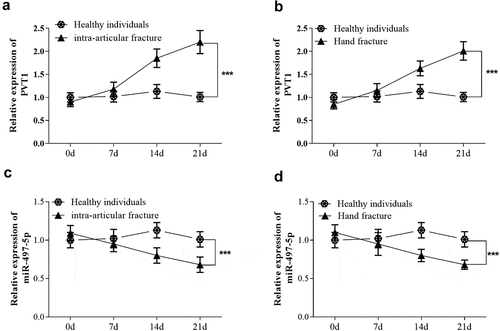
Figure 1. Serum samples were also collected from 80 fragility fracture patients at 7, 14, 21 days after standardized fixation therapy. Levels of lncRNA PVT1 (a) and miR-497-5p (b) were detected at different time points. *** P < 0.001, compared with healthy individuals

Figure 2. hFOB1.19 cells were transfected with pcDNA3.1-PVT1 or si-PVT1 to regulate gene expression (a). The cell viability (b) and apoptosis (c) were detected cell groups under different treatments. ** P < 0.01, *** P < 0.001, compared with control group

Figure 2. hFOB1.19 cells were transfected with pcDNA3.1-PVT1 or si-PVT1 to regulate gene expression (a). The cell viability (b) and apoptosis (c) were detected cell groups under different treatments. ** P < 0.01, *** P < 0.001, compared with control group

Figure 3. Targeted regulatory relationship between PVT1 and miR-497-5p. Starbase predicted the binding sites between PVT1 3ʹUTR and miR-497-5p (a). Luciferase activity assay was performed, and the luciferase activity (b) of cells in the different groups was detected. The levels of miR-497-5p (c) in cells under different transfection were measured using qRT-PCR. ** P < 0.01, *** P < 0.001, compared with control group
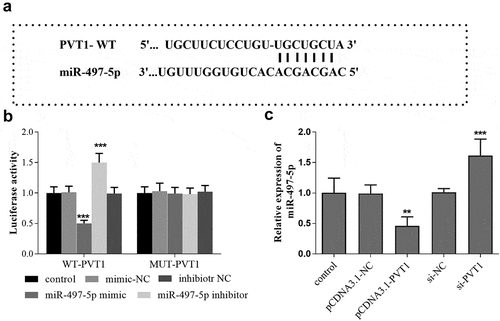
Figure 3. Targeted regulatory relationship between PVT1 and miR-497-5p. Starbase predicted the binding sites between PVT1 3ʹUTR and miR-497-5p (a). Luciferase activity assay was performed, and the luciferase activity (b) of cells in the different groups was detected. The levels of miR-497-5p (c) in cells under different transfection were measured using qRT-PCR. ** P < 0.01, *** P < 0.001, compared with control group

Figure 4. Reverse effect of miR-497-5p downregulation on PVT1 knockdown. Levels of miR-497-5p (a) were detected in cells under different transfection. The cell viability (b) and apoptosis (c) were detected cell groups under different treatment. * P < 0.05, *** P < 0.001, compared with control group; ### P < 0.001, compared with si-PVT1 group

Figure 4. Reverse effect of miR-497-5p downregulation on PVT1 knockdown. Levels of miR-497-5p (a) were detected in cells under different transfection. The cell viability (b) and apoptosis (c) were detected cell groups under different treatment. * P < 0.05, *** P < 0.001, compared with control group; ### P < 0.001, compared with si-PVT1 group

Figure 5. HMGA2 is the target gene of miR-497-5p. TargetScan predicted the binding sites between 3ʹ-UTR of HMGA2 and miR-497-5p (a). Luciferase activity assay was performed, and the luciferase activity (b) of cells in the different groups was detected. The levels of HMGA2 mRNA (c) in cells under different transfection were measured using qRT-PCR. ** P < 0.01, *** P < 0.001, compared with control group; ## P < 0.01, compared with si-PVT1 group
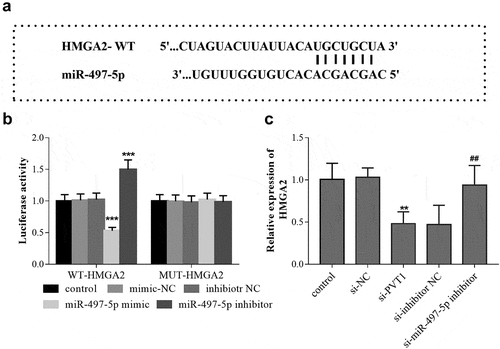
Figure 5. HMGA2 is the target gene of miR-497-5p. TargetScan predicted the binding sites between 3ʹ-UTR of HMGA2 and miR-497-5p (a). Luciferase activity assay was performed, and the luciferase activity (b) of cells in the different groups was detected. The levels of HMGA2 mRNA (c) in cells under different transfection were measured using qRT-PCR. ** P < 0.01, *** P < 0.001, compared with control group; ## P < 0.01, compared with si-PVT1 group