
Figures & data
Table 1. The sequences of primers
Table 2. Fast glucose level, fast insulin level and HOMA-IR index of mice
Figure 1. Downregulation of miR-1224-5p was accompanied with enhanced activation of NLRP3 inflammasome in dehydroepiandrosterone (DHEA)-induced polycystic ovary syndrome (PCOS) mice. (a) Representative images of the ovarian tissue after H&E staining. The levels of (b) luteinizing hormone (LH) and (c) follicle-stimulating hormone (FSH) in the serum of mice. (d) The ratio of LH to FSH. (e) The level of estradiol in the serum of mice. (f) The relative mRNA expression of miR-1224-5p in the ovarian tissue of mice quantified by real-time PCR. (g) The levels of tumor necrosis factor (TNF)-α and interleukin (IL)-1β assessed by ELISA kits. (h) The protein bands and (i) relative protein expression of NOD-like receptor protein 3 (NLRP3), apoptosis-associated speck-like protein containing a C-terminal caspase recruitment domain (ASC), pro-caspase-1 and cleaved caspase-1 quantified by western blotting analysis. Data were shown as mean ± SD (n = 6). *p < 0.05, **p < 0.01, ***p < 0.001 versus Control group
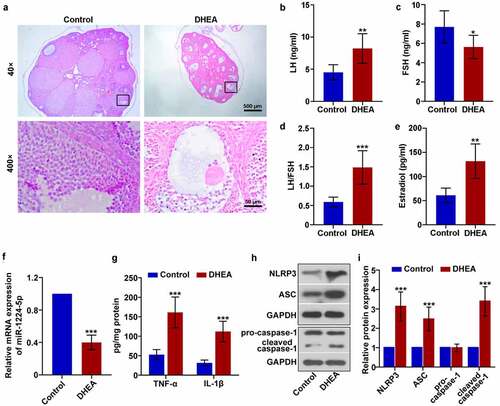
Figure 2. Upregulation of miR-1224-5p attenuated TNF-α-induced secretion of androgens and inflammation in human granulosa-like tumor (KGN) cells. KGN cells were treated with TNF-α for 24 h to establish an in vitro study model. The levels of (a) DHEA and (b) testosterone in TNF-α-treated KGN cells versus controls. (c) The relative mRNA expression of miR-1224-5p following TNF-α treatment. To investigate the role of miR-1224-5p, KGN cells were transfected with miR-1224-5p mimics or negative control (NC) mimics, followed by TNF-α treatment. (d) The relative mRNA expression of miR-1224-5p was determined to verify the efficiency of transfection. (e) The relative mRNA expression of miR-1224-5p in KGN cells with different treatments. The levels of (f) DHEA, (g) testosterone and (h) IL-1β in KGN cells with different treatments. Data were shown as mean ± SD (n = 3). *p < 0.05, **p < 0.01, ***p < 0.001 versus Control group. ++p < 0.01, versus TNF-α+ NC mimics group
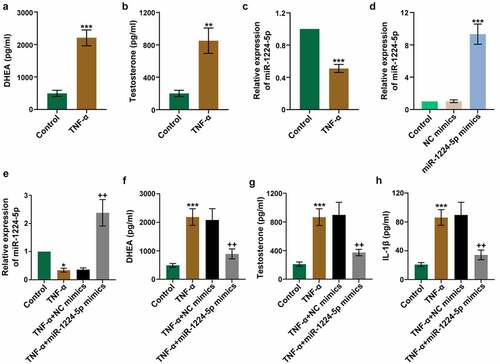
Figure 3. Upregulation of miR-1224-5p inhibited the activation of NLRP3 inflammasome in TNF-α-treated KGN cells. miR-1224-5p was enforced expressed in KGN cells with miR-1224-5p mimics. After 24-h transfection, cells were induced with TNF-α for 24 h. (a) The protein bands and (b) the relative protein expression of NLRP3, ASC, pro-caspase-1 and cleaved caspase-1 in KGN cells. The relative mRNA expression of (c) NLRP3 and (d) ASC in KGN cells. (e) The level of caspase-1 in KGN cells quantified by the ELISA kit. (f) The protein bands and (g) the relative protein expression of FOXO1 and thioredoxin interaction protein (TXNIP) in KGN cells. (h) The relative mRNA expression of TXNIP in KGN cells. Data were shown as mean ± SD (n = 3). ***p < 0.001, versus Control group. ++p < 0.01, +++p < 0.001 versus TNF-α+ NC mimics group
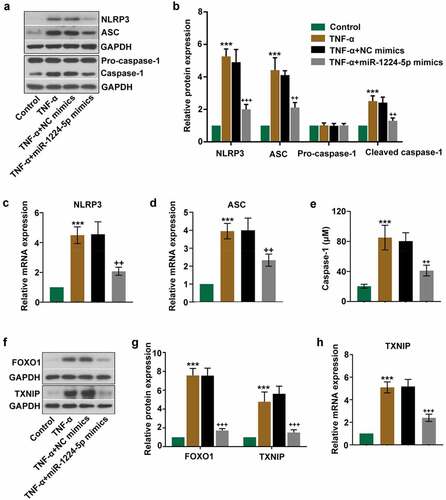
Figure 4. Upregulation of miR-1224-5p inhibited the activation of nuclear factor kappa B (NF-κB) p65 in KGN cells. (a) The protein bands and the relative protein expression of (b) NF-κB p65 and (c) p-NF-κB p65 in KGN cells. (d) Representative images of immunofluorescence staining for NF-κB p65. Scale bar = 50 μm. (e) The protein bands and the relative protein expression of NF-κB p65 in the nucleus in KGN cells. Data were shown as mean ± SD (n = 3). ***p < 0.001, versus Control group. +++p < 0.001, versus TNF-α+ NC mimics group
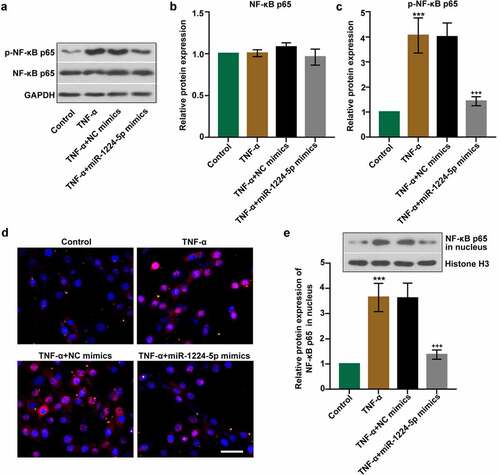
Figure 5. miR-1224-5p inhibited the activation of NLRP3 inflammasome in KGN cells by targeting FOXO1. To investigate the involvement of FOXO1 in the regulation of miR-1224-5p, FOXO1 was enforced upregulated in KGN cells with miR-1224-5p overexpression. (a) Predicted binding site of miR-1224-5p in wild-type FOXO1 3ʹUTR and mutant sites. Luciferase reporter assay was performed in HEK-293 T cells. Following different treatment, (b) the relative mRNA expression of miR-1224-5p in KGN cells. (c-d) The relative mRNA and protein expression of FOXO1 in KGN cells. (e) The protein band and (f) the relative protein expression of NLRP3, ASC, pro-caspase-1 and cleaved caspase-1 in KGN cells. (g) ELISA analysis of IL-1β level in KGN cells. Data were shown as mean ± SD (n = 3). ###P < 0.001, versus NC mimics+FOXO1 3ʹUTR (Wt) group or miR-1224-5p mimics+FOXO1 3ʹUTR (Mut) group. **p < 0.01, ***p < 0.001 versus TNF-α+ NC mimics group. ++p < 0.01, +++p < 0.001 versus TNF-α+ miR-1224-5p mimics+NC vector group
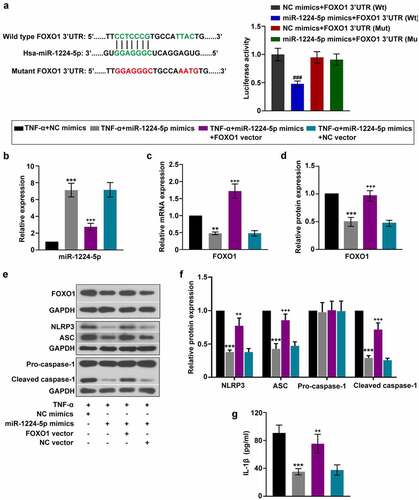
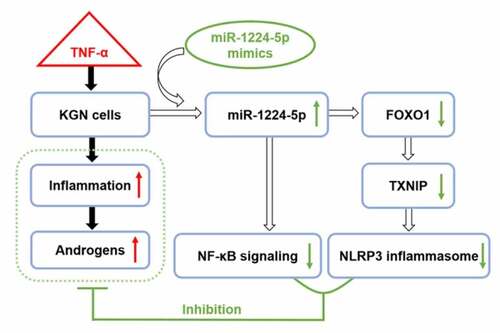
Figure 6. The possible mechanism underlying the regulation of miR-1224-5p/FOXO1 in attenuating the inflammation and androgen excess in TNF-α-treated KGN cells
Supplemental Material
Download ()Data availability statement
The data of this study are available from the corresponding author upon reasonable request.