Figures & data
Figure 1. BBR reduced blood lipid levels in ApoE−/− mice. (a) TC level; (b) TG level; (c) LDL-C level; (d) HDL-C level; (e) Body weight; the findings were presented as mean ± SD; * P < 0.05, ** P < 0.01, *** P < 0.001, **** P < 0.0001
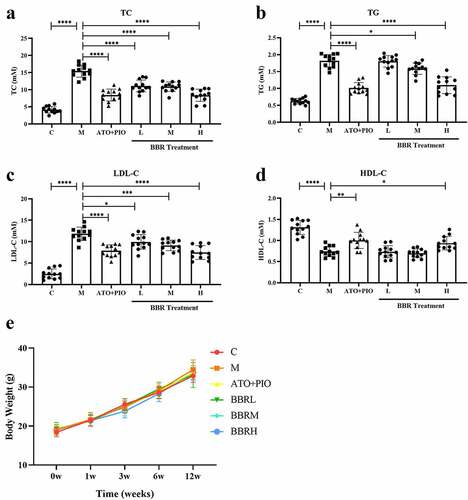
Figure 2. BBR reduced the plaque area in ApoE−/− mice carotid arteries. (a) H&E staining representative image of the carotid artery (large image was magnified 40; small image was magnified 200); (b) the ratio of carotid artery atherosclerotic plaque area to lumen area; the findings were presented as mean ± SD; ** P < 0.01, *** P < 0.001, **** P < 0.0001
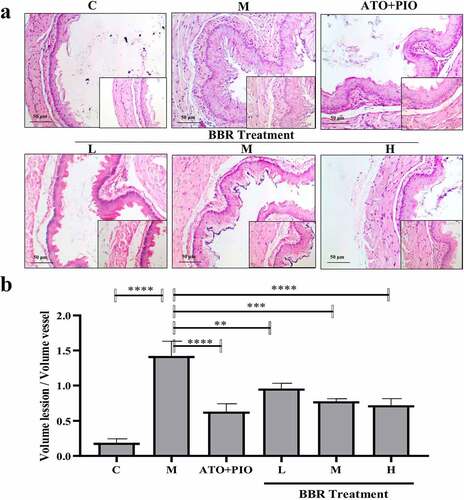
Figure 3. BBR inhibited neointima formation in ApoE−/− mice carotid arteries. (a) H&E staining representative image of carotid artery (magnification 200); (b) carotid artery intima/media thickness ratio; the findings were presented as mean ± SD; * P < 0.05, ** P < 0.01, *** P < 0.001, **** P < 0.0001
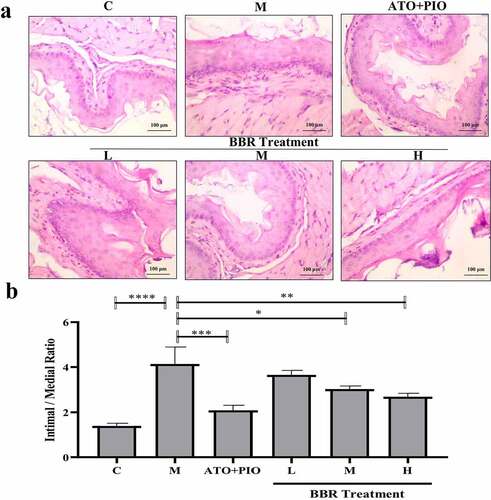
Figure 4. BBR inhibited lipid accumulation in ApoE−/− mice carotid arteries. (a) oil red O staining representative image of carotid artery (magnification 40); (b) Carotid artery lipid droplet area; the findings were presented as mean ± SD; ** P < 0.01, *** P < 0.001, **** P < 0.0001
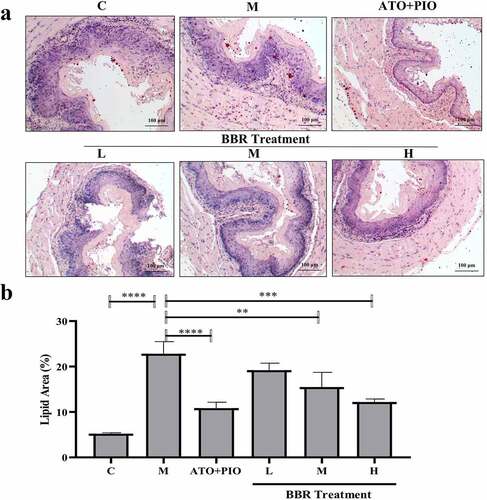
Figure 5. BBR promoted cell proliferation in ApoE−/− mice carotid arteries. (a) Ki67 immunofluorescence staining representative image of carotid artery (magnification 100), the first row represented Ki67 staining of proliferating cells (red), the second row represented nuclear staining by DAPI (blue), and the third row represented the merged image; (b) The proportion of Ki67+ cells in carotid arteries; the findings were presented as mean ± SD; ** P < 0.01, **** P < 0.0001
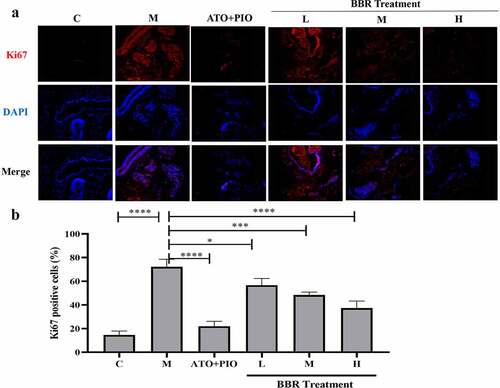
Figure 6. BBR inhibited cell apoptosis in ApoE−/− mice carotid arteries. (a) TUNEL immunofluorescence staining representative image of carotid artery (magnification 100), the first row represented TUNEL staining of apoptotic cells (green), the second represented nuclear staining via DAPI (blue), and the third represented the merged images; (b) the proportion of TUNEL+ cells in the carotid arteries; the findings were presented as mean ± SD; * P < 0.05, **** P < 0.0001
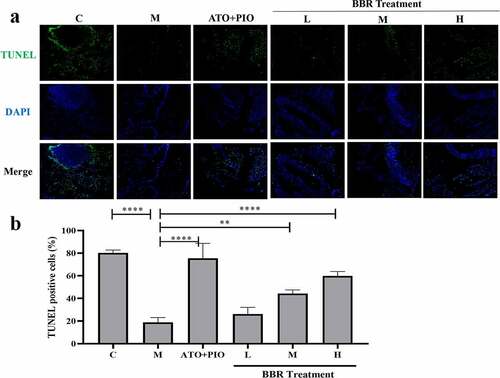
Figure 7. BBR regulated PI3K/AKT/mTOR signaling pathway in ApoE−/− mice carotid arteries. (a) representative image of protein expression relative to PI3K/AKT/mTOR signaling pathway in carotid arteries; (b-f) p-PI3K/PI3K, (b) p-AKT/AKT, (c) p-mTOR/mTOR, (d) Beclin-1, (e-f) P62 protein expression levels in carotid arteries; the findings were presented as mean ± SD; * P < 0.05, ** P < 0.01, *** P < 0.001, **** P < 0.0001