
Figures & data
Figure 1. Cytotoxicity of Apremilast in human nasal epithelial cells (hNECs). Cells were stimulated with Apremilast (0, 0.25, 0.5, 2.5, 5, 25, 50, 100 μM) for 24 hours. (a). Molecular structure of Apremilast; (b). Cell viability was measured by the CCK-8 assay (*, **, ***, P < 0.05, 0.01, 0.001 vs. Vehicle group)
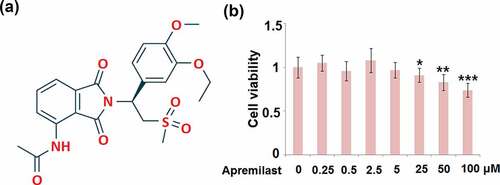
Figure 2. Apremilast attenuated IL-13-induced oxidative stress in hNECs. Cells were stimulated with IL-13 (10 ng/ml) in the presence and absence of Apremilast (2.5, 5 μM) for 24 hours. (a). The levels of ROS; (b). The levels of MDA (***, P < 0.001 vs. vehicle group; #, ##, P < 0.05, 0.01 vs. IL-13 group)
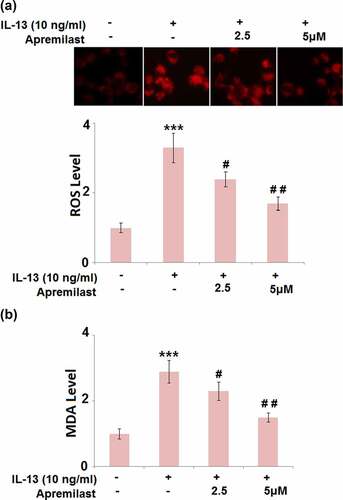
Figure 3. Apremilast inhibited IL-13-induced expression of pro-inflammatory cytokines in hNECs. Cells were stimulated with IL-13 (10 ng/ml) in the presence and absence of Apremilast (2.5, 5 μM) for 24 hours. (a). mRNA of IL-6 and IL-8; (b). Secretions of IL-6 and IL-8 (***, P < 0.001 vs. vehicle group; #, ##, P < 0.05, 0.01 vs. IL-13 group)
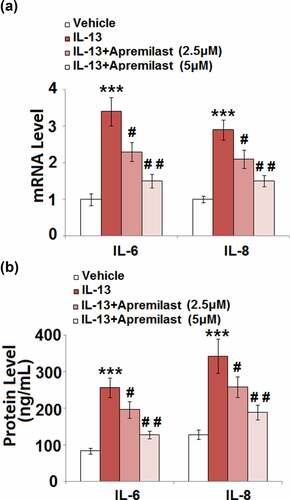
Figure 4. Apremilast suppressed IL-13-induced expressions of CSF2 and CCL11 in hNECs. Cells were stimulated with IL-13 (10 ng/ml) in the presence and absence of Apremilast (2.5, 5 μM) for 24 hours. (a). mRNA of CSF2 and CCL11; (b). Secretions of CSF2 and CCL11 as measured with ELISA (***, P < 0.001 vs. vehicle group; #, ##, P < 0.05, 0.01 vs. IL-13 group)
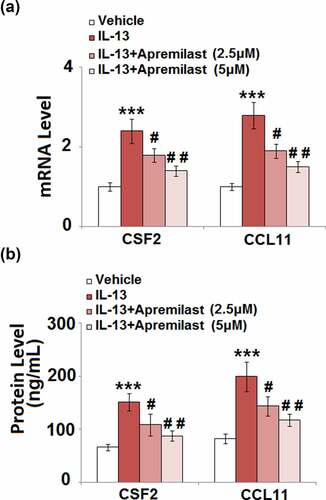
Figure 5. Apremilast inhibited the expression of Mucin 4 and Mucin 5AC (MUC5AC) in hNECs. Cells were stimulated with IL-13 (10 ng/ml) in the presence and absence of Apremilast (2.5, 5 μM) for 24 hours. (a). mRNA of Mucin 4 and MUC5AC; (b). Secretions of Mucin 4 and MUC5AC (***, P < 0.001 vs. vehicle group; #, ##, P < 0.05, 0.01 vs. IL-13 group)
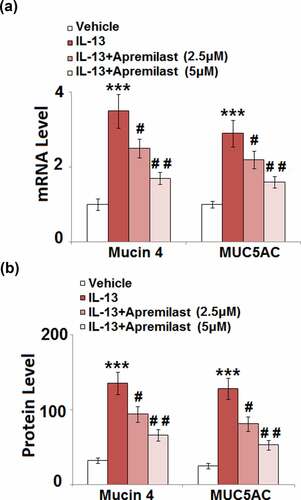
Figure 6. Apremilast mitigated the activation of JNK in IL-13 challenged hNECs. Cells were stimulated with IL-13 (10 ng/ml) in the presence and absence of Apremilast (2.5, 5 μM) for 24 hours. The levels of p-JNK and total JNK were measured by western blot analysis (***, P < 0.001 vs. vehicle group; #, ##, P < 0.05, 0.01 vs. IL-13 group)
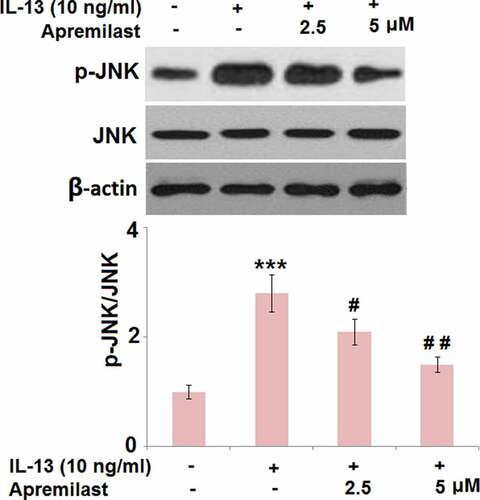
Figure 7. Apremilast prevented activation of the transcriptional factor AP-1. Cells were stimulated with IL-13 (10 ng/ml) in the presence and absence of Apremilast (2.5, 5 μM) for 24 hours. (a). The expressions of c-fos and c-Jun; (b). Luciferase activity of AP-1 (***, P < 0.001 vs. vehicle group; #, ##, P < 0.05, 0.01 vs. IL-13 group)
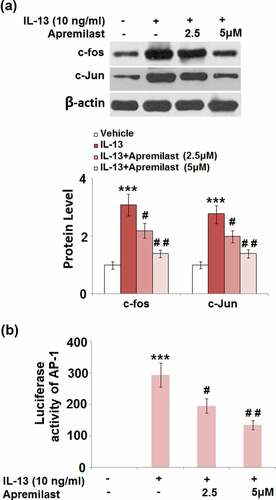
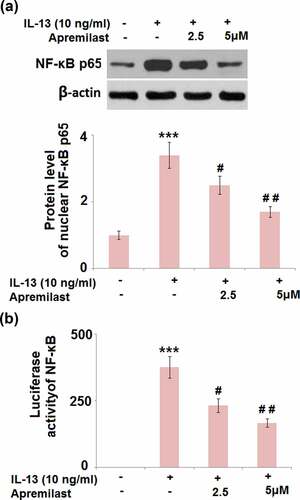
Figure 8. Apremilast ameliorated IL-13- induced activation of the transcriptional factor NF-κB. Cells were stimulated with IL-13 (10 ng/ml) in the presence and absence of Apremilast (2.5, 5 μM) for 24 hours. (a). Protein level of nuclear NF-κB p65;(b)Luciferase activity of NF-κB (***, P < 0.001 vs. vehicle group; #, ##, P < 0.05, 0.01 vs. IL-13 group)
Availability of data and materials
Data and materials of this study are available upon reasonable request to the corresponding authors.