Figures & data
Figure 1. Lung cancer patient characteristics and hypoxia-related gene identification. (A) Consensus matrices of NSCLC patients for k=2 based on 205-hypoxia-related genes in three GEO cohort; (B) NSCLC cases are divided into two subtypes based on unsupervised analysis; (C) Differences in patient overall survival with two clusters; (D) Cox proportional hazard regression of survival months and survival status were performed using gene set enrichment scores for the six hypoxia-associated gene signatures. Log-rank test was used to determine significant p values
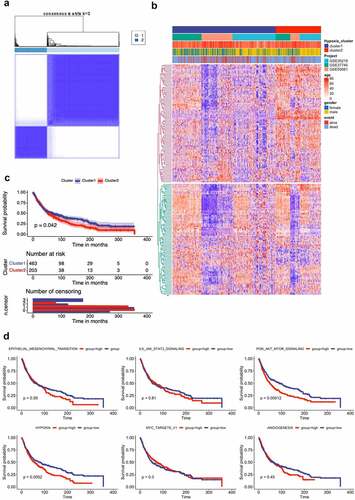
Figure 2. Immune Landscape Between Low and High Hypoxia Risk NSCLC Patients. (A) and (B) The 22 immune cells proportions obtained from 666 lung cancer patients in GEO databases; (C) Rows of the heatmap show expression of TME-infiltrating cell signatures calculated by xCell; (D) Kaplan-Meier plots of infiltrating immune cells with differential expression as described above
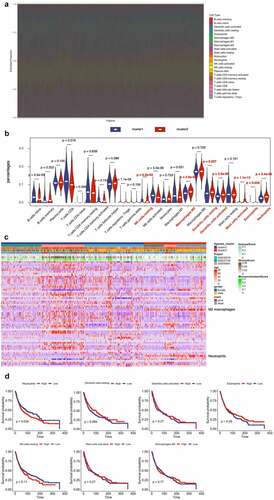
Figure 3. Validation of hypoxia-related gene set in the TCGA cohort. (A) Consensus matrices of NSCLC patients for k=2 based on 205-hypoxia-related genes in the TCGA cohort; (B) Differences in patient overall survival with two clusters; (C) Establishment of a prognosis-predictive model dividing patients into high and low risk groups; (D) Differences in patient overall survival with high and low risk groups; (E) Time-dependent ROC curves for the risk score in the TCGA dataset for predicting 1, 3, and 5-year OS; (F) Nomogram based on risk score, age, gender, and stage; (G) Calibration plots of the nomogram for predicting the probability of OS at 5 years in the TCGA dataset
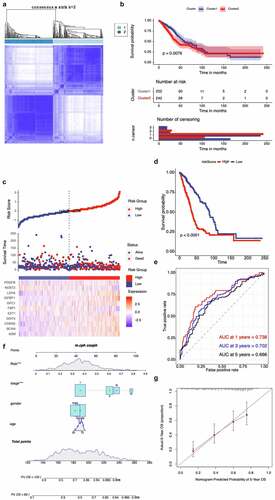
Figure 4. CXCL6 is the critical chemokine induced by hypoxic NSCLC cell to recruit TANs derived from NSCLC tissues. (A) Quantification of neutrophil migration as assessed by transwell assays; (B) and (C) Expression of CXCL6 in hypoxic or normoxic NSCLC cells was examined by real-time PCR and ELISA; (D) Quantification of neutrophil migration as assessed by transwell assays
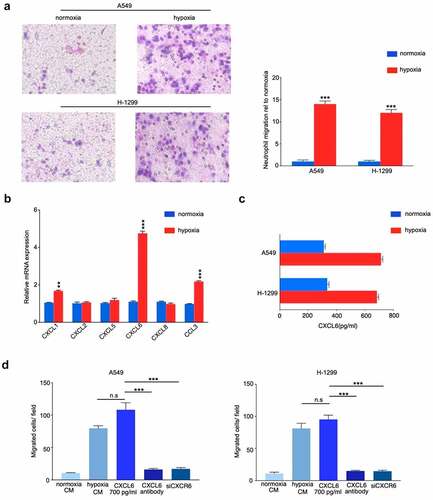
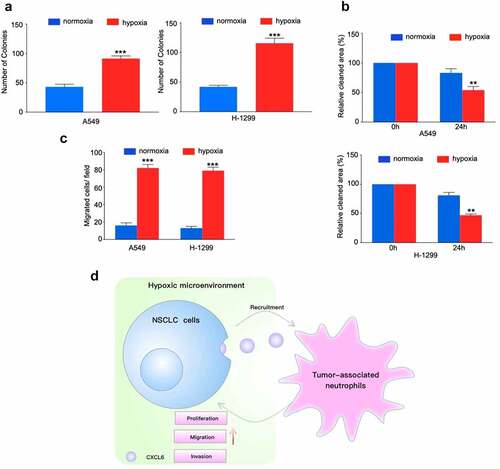
Figure 5. TANs derived from NSCLC tissues promote NSCLC cells proliferation, migration and invasion. (A), (B) and (C): NSCLC cells cocultured with TANs or alone were subjected to colony formation, wound healing, and transwell invasion assays; (D) Schematic illustration of the crosstalk between CXCL6-overexpressing NSCLC cells and TANs in the TME