
Figures & data
Table 1. LASSO analysis results of 14 common DEGs in 3 datasets
Figure 1. Bioinformatics analysis results. (a) The differential genes heatmap of GSE62646, GSE66360 and GSE123342; (b) Venn diagram of DEGs; (c) GO enrichment analysis of 14 common DEGs; (d) KEGG enrichment analysis of 14 common DEGs; (e) PPI analysis of common differential genes; (f) The expression of four key genes at different stages in GSE123342
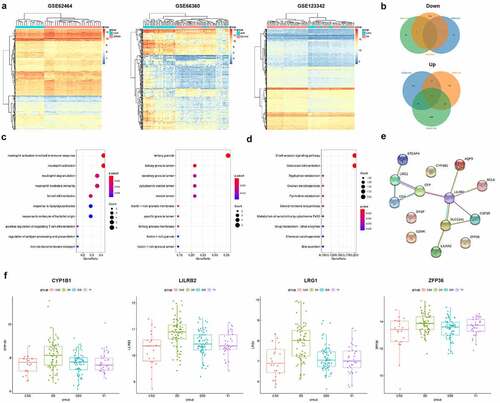
Figure 2. Effect of hypoxia on H9c2. (a) Cell viability was detected by CCK-8 after hypoxia treatment (0, 4, 8, 12, 18, 24 h); (b) Apoptosis was detected by Annexin V-FITC/PI staining; (c) Autophagy was detected by immunofluorescence assay (the scale bars = 50 μm); (d) Western blot was used to detect the expression of Bax, Bcl2, LC3, p62 and LRG1 protein. *P < 0.05, **P < 0.01, ***P < 0.001
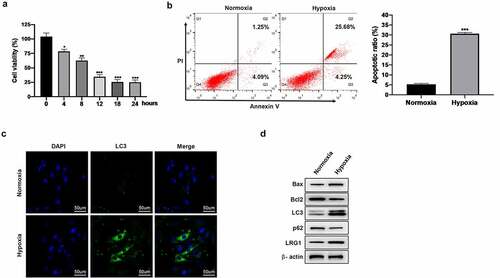
Figure 3. Effect of LRG1 on cell viability and cell apoptosis in H9c2. (a) The interference effect of siLRG1 was detected by western blot; (b) Cell viability was detected by CCK-8; (c) Apoptosis was detected by Annexin V-FITC/PI staining; (d) Western blot was used to detect the expression of Bax and Bcl2 protein. When normoxia as control, ***P < 0.001. When hypoxia + siNC as control, ##P < 0.01, ###P < 0.001
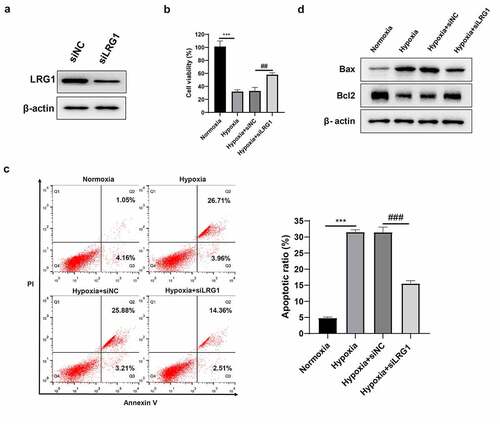
Figure 4. Effect of LRG1 on autophagy. (a) Autophagy was detected by immunofluorescence assay (the scale bars = 50 μm); (b) LC3 and p62 protein expression were detected by western blot
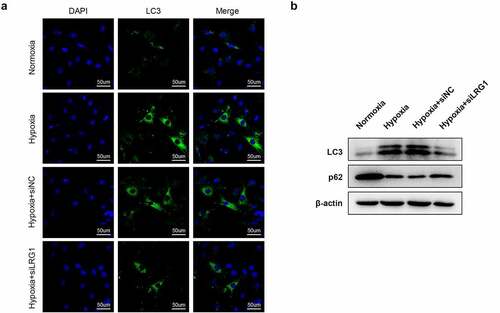
Figure 5. Effect of LRG1 on HIF-1α in normoxia H9c2. (a) Western blot was applied to detect the effect of LRG1 overexpression plasmid and siLRG1; (b) Western blot was used to detect HIF-1α protein expression
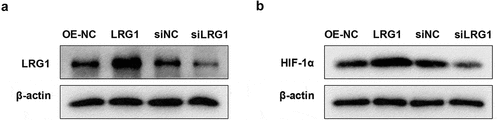
Figure 6. siHIF-1α reversed the effect of LRG1 on H9c2 viability and cell apoptosis. (a) The interference effect of siHIF-1α was detected by western blot; (b) Cell viability was detected by CCK-8; (c) Apoptosis was detected by Annexin V-FITC/PI staining; (d) Western blot was used to detect the expression of Bax and Bcl2 protein. When normoxia as control, ***P < 0.001. When hypoxia+OE-NC as control, ###P < 0.001. When hypoxia+LRG1+ siNC as control, &&P < 0.01
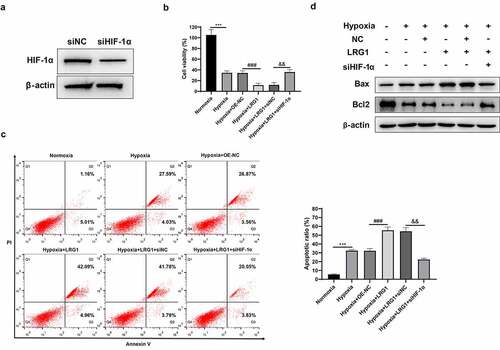
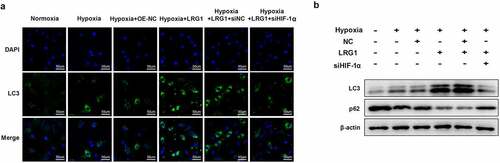
Figure 7. siHIF-1α reversed the effect of LRG1 on autophagy in H9c2. (a) Autophagy was detected by immunofluorescence assay (the scale bars = 50 μm); (b) LC3 and p62 protein expression were detected by western blot
Data availability statement
The datasets used and/or analyzed during the current study are available from the corresponding author on reasonable request.