
Figures & data
Table 1. Primers used for qRT-PCR
Figure 1. Changes in the proliferation of mouse liver sinusoidal endothelial cells (LSECs) cultured under hypoxic conditions. (a) Representative images of EdU staining assay of mouse LSECs cultured under hypoxia or normoxia for 24 h. (b) The average number of positive cells in Edu staining after LESCs were cultured in hypoxia or normoxia for 24 h. Data are shown as the mean ± SEM. n = 3 per group,***p < 0.001 vs control group (normoxia) by Student’s t-test
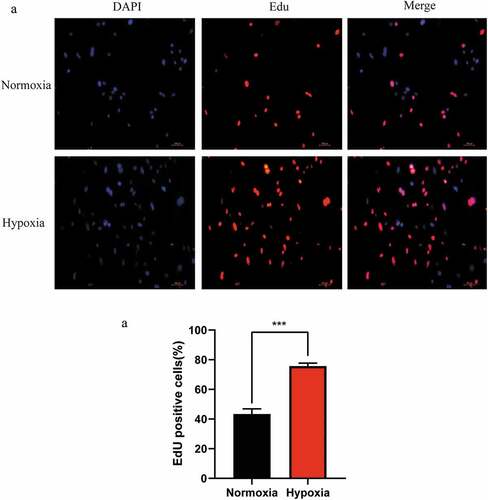
Figure 2. Gene Ontology (GO) and Kyoto Encyclopedia of Genes and Genomes (KEGG) enrichment analysis based on miRNA-targeted genes. (a), (b), and (c) illustrate significant GO-biological processes (BP) enrichment analysis of MF (molecular functions), CC (cellular components), and pathways, respectively, targeted by downregulated genes. Similarly, (d), (e), and (f) show the same content in upregulated genes
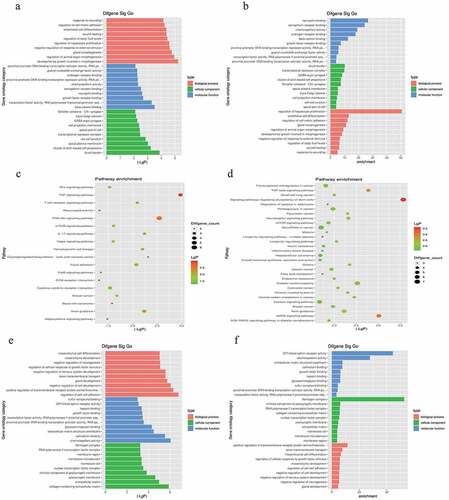
Figure 3. The fine cluster map of miRNA and its predicted target genes were significantly altered in mouse liver sinusoidal endothelial cells (LSECs) cultured in hypoxia and normoxia (control group) for 24 h. (a) The expression profile of miRNA in mouse LSECs after 24 h of hypoxia and normoxia (control group). A1, A2, A3 served as control groups. (b) The target genes predicted by differentially expressed (DE) miRNA were enriched by GO-BP and KEGG, and the target intersecting genes related to LSECs and hepatocyte proliferation were intersected by the list of genes enriched in pathway and function. Combined with their initial expression values, the fine cluster map of mRNA was obtained. A total of 22 meaningful DE target genes were obtained, including 13 upregulated genes and 9 downregulated genes
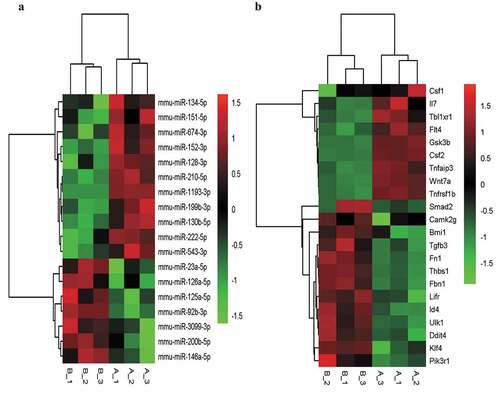
Figure 4. An interaction network of the miRNAs and their targets in liver sinusoidal endothelial cells (LSECs) cultured under hypoxia for 24 h
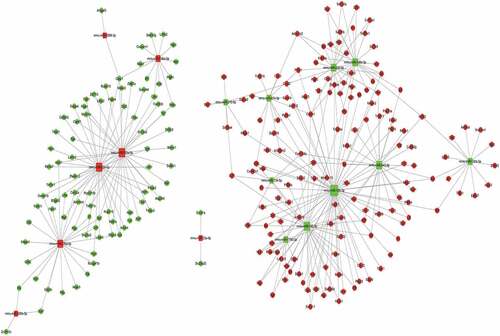
Figure 5. Quantitative real-time PCR (qPCR) validation of the differentially expressed mRNAs (TOP 6) identified by transcriptomic analysis. (a),(b),(c),(d),(e),(f) show up-regulated mRNAs; (g),(h),(i),(j),(k),(l) show down-regulated mRNAs .Data are shown as the mean ± SEM,n = 3 per group,*p < 0.05, ***p < 0.001,****p < 0.0001 vs control group (normoxia), by Student’s t-test
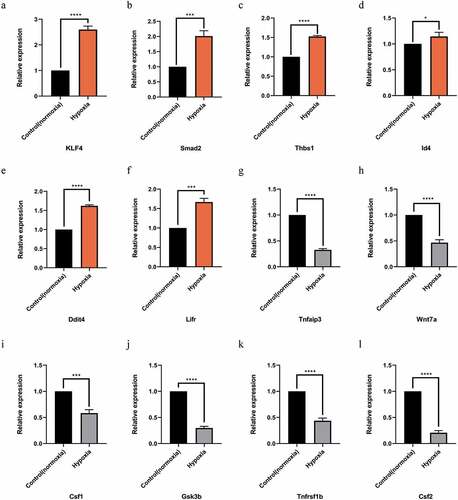
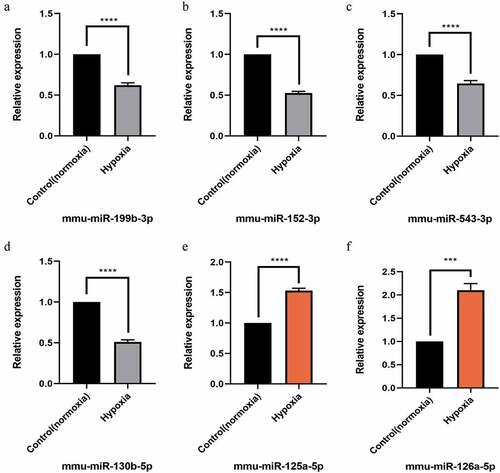
Figure 6. Quantitative real-time PCR (qPCR) validation of the differentially expressed miRNAs (TOP 6) identified by transcriptomic analysis.(a),(b),(c),(d) show down-regulated miRNAs;(e),(f) show up-regulated miRNAs. Data are shown as the mean ± SEM, n = 3 per group, ***p < 0.001,****p < 0.0001 vs control group (normoxia), by Student’s t-test
Supplemental Material
Download ()Data availability statement
The data used to support the findings of this study are available from the corresponding author upon request.