
Figures & data
Table 1. Primers for plasmid construction
Table 2. The primers for RT-PCR
Table 3. Antibodies for western blotting
Figure 1. miR-4423-3p inhibits proliferation of HFLS-RA. A: The levels of miR-4423-3p were differentially expressed in healthy people (n = 18) and RA patients (n = 28) in data from the GEO database (GSE124373); ***P < 0.001. B: Intracellular miR-4423-3p expression changes in different groups. C: The MTT assay was used to determine the changes of cell viability in each group. D: Representative images of EdU assay (left) and statistical histograms of EdU+ cells (right). E: Representative images of cell cycle assay (left) and statistical histograms of cell proportions in different phases (right). F: Representative image of apoptosis assay and statistical histogram of the proportion of apoptotic cells in different groups. Mann-Whitney test (a) and student’s t test (b–f) were used for statistical analysis. All experiments were carried out independently at least three times. PI: propidium iodide. **P < 0.01, ***P < 0.001 vs. mimic NC; ns: not significant, #P < 0.05, ##P < 0.01, ###P < 0.001 vs. inhibitor NC
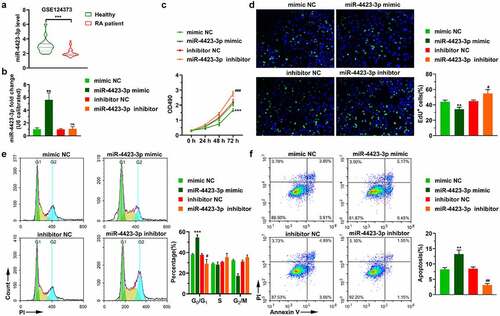
Figure 2. miR-4423-3p suppresses migration and invasion of HFLS-RA. A: Representative images of migrated cells (up) and statistical histograms of the number of migrated cells in per field in different groups (bottom). B: Representative images of invasive cells (up) and statistical histograms of the number of invasive cells in per field in different groups (bottom). Student’s t test (a and b) was used for statistical analysis. All experiments were carried out independently at least three times. *P < 0.05, ***P < 0.001 vs. mimic NC; ##P < 0.01 vs. inhibitor NC
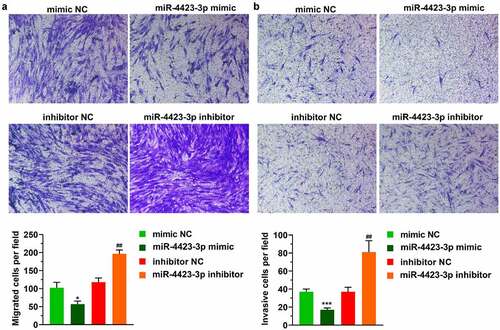
Figure 3. MMP13 is a direct target of miR-4423-3p. A: Venn diagram of mRNAs targeted by miR-4423-3p. B: Schematic diagram of the 3ʹUTR mutation site of MMP13. C: Dual-luciferase reporter assay verified the targeting relationship between miR-4423-3p and MMP13. Ns: not significant, **P < 0.01 vs. mimic NC. D and E: After overexpression or inhibition of miR-4423-3p in HFLS-RA, mRNA and protein levels of MMP13 were detected by RT-PCR (d) and western blotting (e), respectively. ****P < 0.0001 vs. mimic NC; ###P < 0.001 vs. inhibitor NC. F: Analysis of the difference of MMP13 levels between RA patients (n = 16) and healthy volunteers (n = 7) from GSE77298; ***P < 0.001. Student’s t test (c and d) and Mann-Whitney test (f) were used for statistical analysis. All experiments were carried out independently at least three times
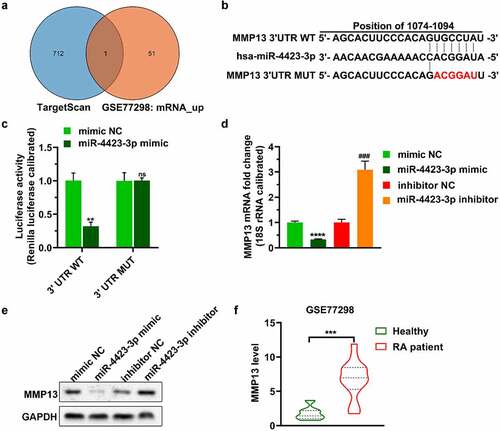
Figure 4. Replenishing MMP13 promotes cell proliferation and decreases apoptosis. The miR-4423-3p mimic and MMP13 OE plasmid were co-transfected into HFLS-RA. A: The RNA levels of miR-4423-3p and MMP13 were tested by RT-PCR. B: The protein level of MMP13 was detected by western blotting. C and D: Cell proliferation was analyzed using MTT (c) and EdU (d) assays. E: Cell cycle was detected using PI staining. F: Apoptosis was analyzed using Annexin V-FITC/PI staining. One-way ANOVA (A‒F) was used for statistical analysis. All experiments were carried out independently at least three times. PI: propidium iodide; mimic NC + Vector: mimic NC and pCDH-EF1α-Flag-T2A-puro vector were co-transfected into HFLS-RA; miR-4423-3p mimic + Vector: miR-4423-3p mimic and pCDH-EF1α-Flag-T2A-puro vector co-transfected into HFLS-RA; miR-4423-3p mimic + MMP13 OE: miR-4423-3p mimic and MMP13 OE plasmid co-transfected into HFLS-RA. **P < 0.01, ***P < 0.001, ****P < 0.0001 vs. mimic NC + Vector; ns: not significant, ##P < 0.01, ###P < 0.001, ####P < 0.0001 vs. miR-4423-3p mimic + Vector
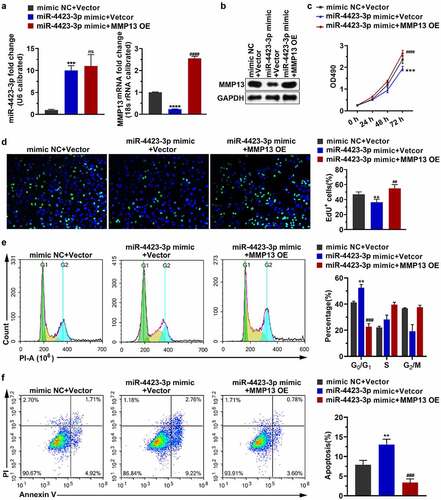
Figure 5. miR-4423-3p suppresses migration and invasion of HFLS-RA by targeting MMP13. A: Representative images of migrated cells (left) and statistical histograms of the number of migrated cells in per field in different groups (right). B: Representative images of invasive cells (left) and statistical histograms of the number of invasive cells in per field in different groups (right). One-way ANOVA (a and b) was used for statistical analysis. All experiments were carried out independently at least three times. mimic NC + Vector: mimic NC and pCDH-EF1α-Flag-T2A-puro vector co-transfected into HFLS-RA; miR-4423-3p mimic + Vector: miR-4423-3p mimic and pCDH-EF1α-Flag-T2A-puro vector co-transfected into HFLS-RA; miR-4423-3p mimic + MMP13 OE: miR-4423-3p mimic and MMP13 OE plasmid co-transfected into HFLS-RA. ***P < 0.001 vs. mimic NC + Vector; ####P < 0.0001 vs. miR-4423-3p mimic + Vector
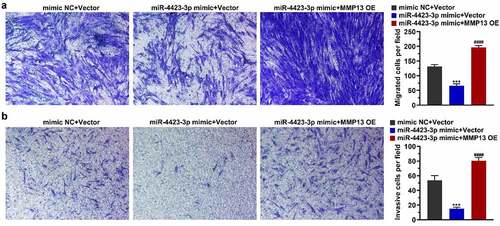
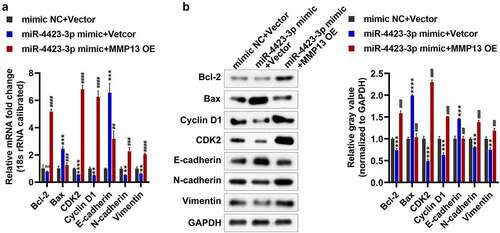
Figure 6. Detection of apoptosis, cell cycle and EMT-related genes. A: The mRNA levels of Bax, Bcl-2, CDK2, Cyclin D1, E-cadherin, N-cadherin, and Vimentin were tested by RT-PCR. B: The protein levels of Bax, Bcl-2, CDK2, Cyclin D1, E-cadherin, N-cadherin, and vimentin were tested by western blotting. One-way ANOVA (a and b) was used for statistical analysis. All experiments were carried out independently at least three times. mimic NC + Vector: mimic NC and pCDH-EF1α-Flag-T2A-puro vector co-transfected into HFLS-RA; miR-4423-3p mimic + Vector: miR-4423-3p mimic and pCDH-EF1α-Flag-T2A-puro vector co-transfected into HFLS-RA; miR-4423-3p mimic + MMP13 OE: miR-4423-3p mimic and MMP13 OE plasmid co-transfected into HFLS-RA. ns: not significant, **P < 0.01, ***P < 0.001, ***P < 0.001 vs. mimic NC + Vector; ##P < 0.01, ###P < 0.001, ####P < 0.0001 vs. miR-4423-3p mimic + Vector
Data availability statement
The data that support the findings of this study are available from the corresponding author upon reasonable request.