
Figures & data
Figure 1. The overall protocol of this study
DEG, differentially expressed gene; FRG, ferroptosis-related gene; DEFRG, differentially expressed FRG; PPI, protein–protein interaction; CSE, cigarette smoke extract; VSMC, vascular smooth muscle cell.
Figure 2. GSEA and identification of differentially expressed genes
(A) Analysis of relationship between ferroptosis and TAAD by GSEA in GSE153434. (B) Clustered heatmap of DEGs in GSE153434 (FDR < 0.05 and |log2FC| ≥ 1). (C) Volcano plot of DEGs in GSE153434 (FDR < 0.05 and |log2FC| ≥ 1). DEG, differentially expressed gene.
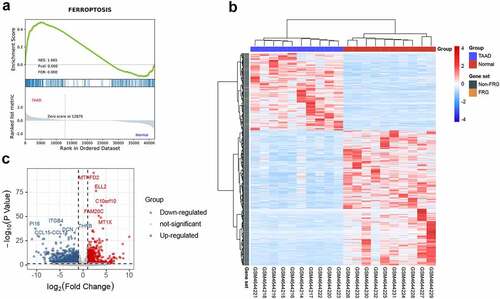
Figure 3. Identification of differentially expressed ferroptosis-related genes
(A) Venn diagram showing the overlap of genes between DEGs in GSE153434 and FRGs in the FerrDB and GeneCard databases, * = selected DEFRG set. (B) Clustered heatmap of DEFRGs in GSE153434. (C) Correlation heatmap of DEFRGs in GSE153434, correlation coefficients are plotted with negative correlation (blue) and positive correlation (red). DEG, differentially expressed gene; DEFRG, differentially expressed ferroptosis-related gene.
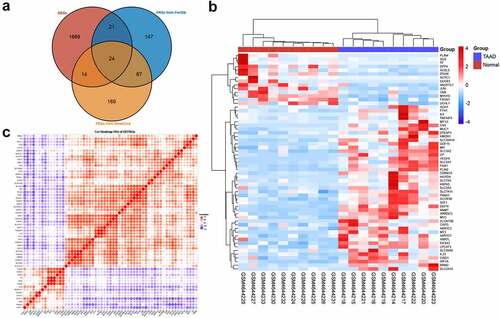
Figure 4. GO and KEGG enrichment analyses of differentially expressed ferroptosis-related genes
GO enrichment analysis of DEFRGs in (A) the biological process category (BP); (B) the cellular component category (CC); (C) the molecular function category (MF). (D) KEGG enrichment analysis of DEFRGs. Crosstalk analysis between DEFRGs and (E) gene functions in BP; (F) gene functions in CC; (G) gene functions in MF; (H) KEGG pathways. DEFRG, differentially expressed ferroptosis-related gene.
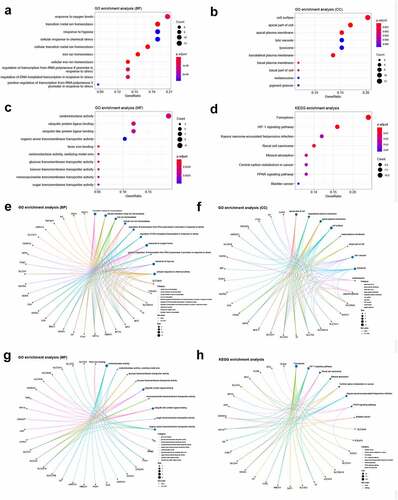
Figure 5. PPI network and identification of key modules and hub genes
(A) PPI network of all DEFRGs constructed by STRING database. (B) three key modules identified by the Cytoscape plugin MCODE (the parameters were set to default: degree cutoff = 2, node score cutoff = 0.2, K-core = 2 and Max depth = 100). (C) Crosstalk between top 10 hub genes ranked by MCC algorithm and other DEFRGs. (D) Crosstalk between top 10 hub genes ranked by MCC algorithm, the deeper color of the dot means that the rank order of the hub gene is more advanced. DEFRG, differentially expressed ferroptosis-related gene.
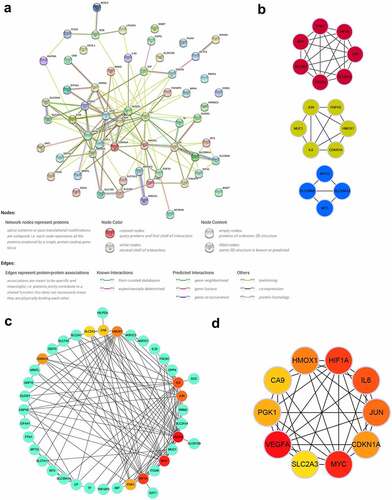
Figure 6. Validation of hub genes in GSE52093 and CSE-induced VSMC injury model
(A) Expression levels of hub genes in TAAD and normal aortic samples in GSE52093. (B) Receiver operating characteristic (ROC) analysis showed the predictive performance of hub genes for TAAD in GSE52093 (AUC, area under the ROC curve). (C) A7r5 cells were treated with 100% cigarette smoke extract (CSE) for 4 h in the presence or absence of Fer-1 (5 μM), cell viability was assessed using the CCK8 assay (n = 3). (D-J) Changes in mRNA expression of hub genes after 4 h of 100%CSE treatment in the presence or absence of Fer-1 (5 μM) by qRT-PCR (n = 3). *p < 0.05, **p < 0.01, ***p < 0.001, ****p < 0.0001, ns = not significant.
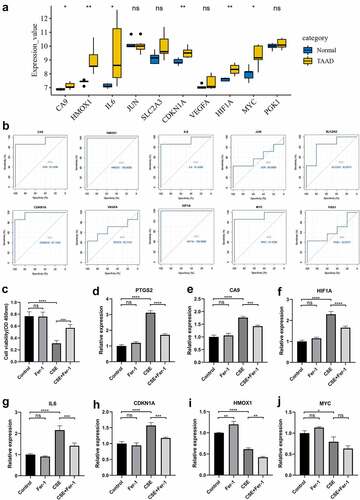
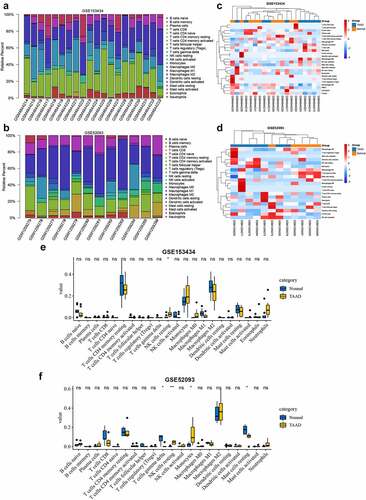
Figure 7. Immune infiltration analyses by the CIBERSORT algorithm in GSE153434 and GSE52093
the proportional histograms of the 22 immune cells calculated by the CIBERSORT algorithm in GSE153434 (A) and GSE52093 (B). Clustering heat map of immune cells in GSE153434 (C) and GSE52093 (D). Differences in the proportion of immune cells in TAAD and normal aortic samples in GSE153434 (E) and GSE52093 (F). Immune cells with a proportion of zero were hidden. *p < 0.05, **p < 0.01, ns = not significant.
Supplemental material
Supplemental Material
Download Zip (796.6 KB)Data availability
Publicly available datasets were analyzed in this study. The data used to support the results of this study are available from the online website as mentioned above.