Figures & data
Figure 1. circFOXP1 is closely associated with poor prognosis in osteosarcoma. (a) circFOXP1 expression was measured in 40 osteosarcoma tissues and 40 noncancerous tissues via qRT-PCR. ***P < 0.001. (b) Kaplan-Meier survival analysis was performed to investigate the overall survival of patients in circFOXP1 high (N = 20)/low (N = 20) groups. ***P < 0.001. (c) circFOXP1 expression was determined in different osteosarcoma cell lines (U2OS, MG-63, HOS, and SAOS-02) and in human osteoblast cell line (hFOB1.19) using qRT-PCR. **P < 0.01, ***P < 0.001 vs hFOB1.19 group
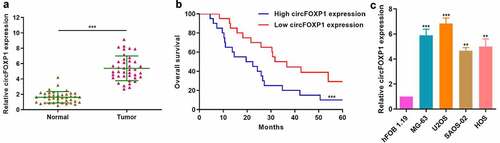
Figure 2. circFOXP1 promotes tumor growth and angiogenesis in osteosarcoma. (a) circFOXP1 expression was detected through qRT-PCR in MG-63 and U2OS cells treated with a lentivirus-based shRNA targeting FOXP1. **P < 0.01. (b–e) In vivo studies were performed with U2OS and MG-63 cells. Typical xenograft images (b). The tumor volume (c, d). *P < 0.05; **P < 0.01. (e–f) Immunohistochemistry was performed to measure CD31 expression in MG-63 and U2OS tumors (f). The microvascular density in tumor xenografts was assessed (g–h). **P < 0.01
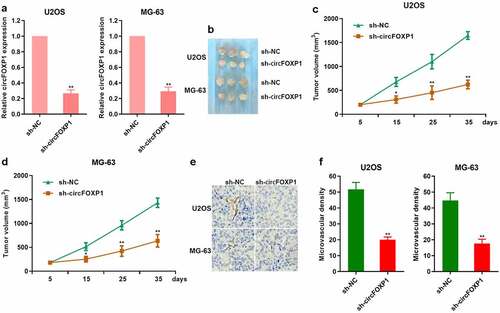
Figure 3. circFOXP1 promoted CDKN2AIP expression. (a-b) The expression of CDKN2AIP mRNA was detected by qRT-PCR (a) and CDKN2AIP protein was detected by western blot (b) when cells treated with circFOXP1 siRNA. (c-d) Tube formation assay was detected after CDKN2AIP siRNA (c) and circFOXP1 siRNA (d) usage. **P < 0.01
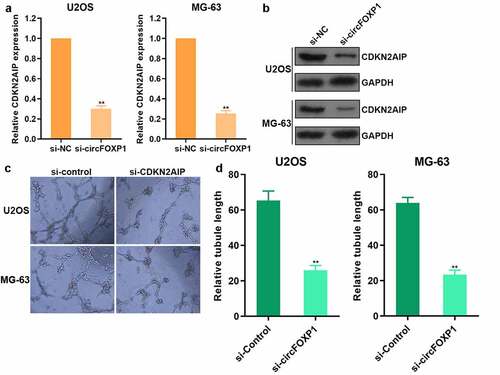
Figure 4. circFOXP1 could have competitive combination of miR-127-5p. (a) The diagram of the binding site of circFOXP1 and miR-127-5p, and the mutation site of circFOXP1. (b) The combination of circFOXP1 and miR-127-5p was confirmed using luciferase reporter assay. (c) miR-127-5p expression in osteosarcoma cells was detected by qRT-PCR after circFOXP1 inhibition. (d) miR-127-5p expression in osteosarcoma was detected, and the correlation between miR-127-5p and circFOXP1 was analyzed. ***p < 0.001
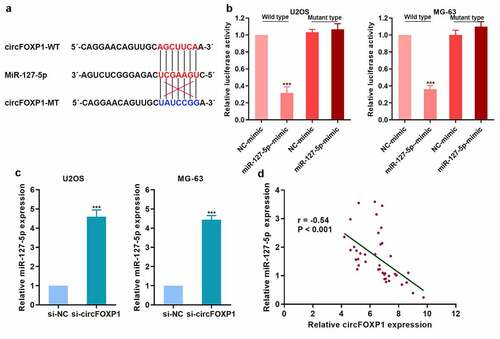
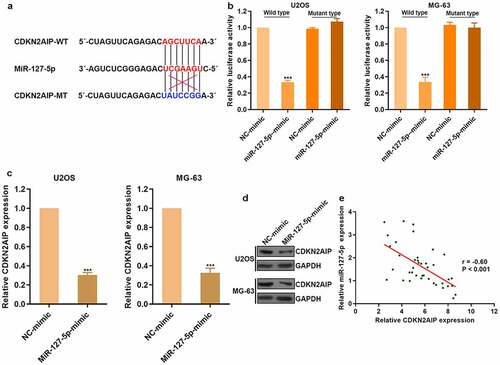
Figure 5. miR-127-5p could directly target CDKN2AIP. (a) The binding site of miR-127-5p with CDKN2AIP and the mutation site of CDKN2AIP were shown. (b) CDKN2AIP was the target of miR-127-5p by luciferase reporter assay. (c) The expression of CDKN2AIP mRNA was detected by qRT-PCR after the treatment of miR-127-5p mimic. (d) CDKN2AIP expression in osteosarcoma was detected, and the correlation between CDKN2AIP and miR-127-5p was analyzed. ***p < 0.001