Figures & data
Table 1. The clinical characteristics of gastric cancer patients (n = 47)
Figure 1. Overexpression of circ_HN1 in gastric cancer. (a) Left: Volcano plot showing the differently expressed circRNAs in gastric cancer tissues. Right: 3 up-regulated circRNAs (circ_HN1, circ_102614, and circ_103122) in gastric cancer tissues when the |log2FC| > 4, P < 0.05. (b) qRT-PCR showing the overexpression of circ_HN1, circ_102614 and circ_103122 in HGC27 and MKN74 gastric cancer cells compared to the nontumor GES-1 cells. (c) Upregulation of circ_HN1 in 47 gastric primary tumors compared with the normal gastric tissues. (d and e) The stability of circ_HN1 analyzed by actinomycin D assay in HGC27 and MKN74 cells. (f and g) Subcellular localization assay showing the cytoplasmic localization of circ_HN1 in HGC27 and MKN74 cells. *P < 0.05
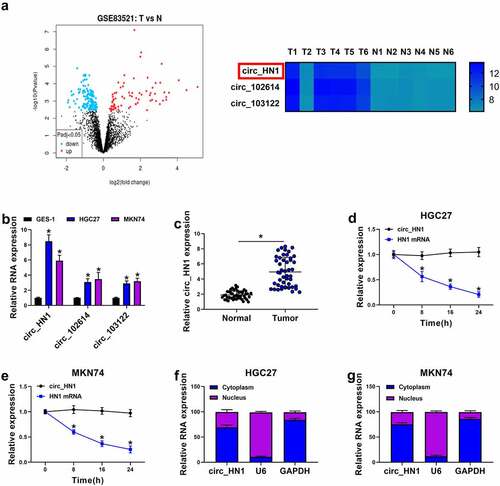
Figure 2. Effects of circ_HN1 depletion on cell migration, proliferation, invasion, spheriod formation and apoptosis in vitro. MKN74 and HGC27 cells were transduced by lentiviruses expressing sh-circ_HN1 or the scrambled control (sh-NC). (a and b) qRT-PCR showing the reduction of circ_HN1 and unvaried expression of HN1 mRNA in transduced cells. (c) Representative pictures depicting a cell colony formation assay and showing the suppressed colony formation by circ_HN1 depletion. (d) Spheriod formation. Phase contrast micrographs of day 14 in ultra-low attachment plate culture. (e) Representative images presenting a cell proliferation assay and cell proliferation by EdU assay. (f and g) MTT assay revealing cell proliferation repression caused by circ_HN1 loss of function. (h) The repression of PCNA expression in transduced cells determined by western blot. (i) Representative images showing a cell apoptosis assay performed by flow cytometry. (j and k) Western blot showing the alteration of Bcl-2 and Bax levels in circ_HN1-silencing cells. (l and m) Representative images depicting cell migration and invasion assays performed by transwell assay. *P < 0.05
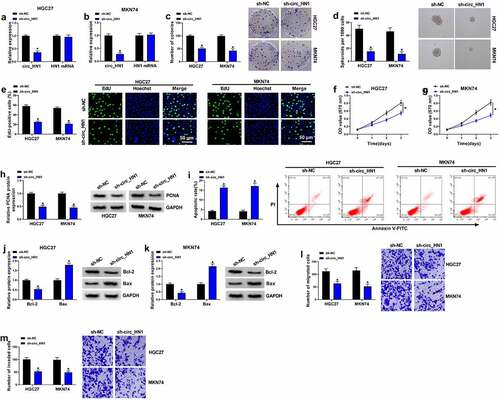
Figure 3. Overexpression of NT5E in gastric cancer. (a) Left: Volcano plot showing the deregulated genes in gastric cancer tissues. Right: 9 up-regulated genes in gastric cancer tissues when the |log2FC| > 3.5, P < 0.05. (b and c) qRT-PCR of the 9 genes expression in sh-NC- or sh-circ_HN1-infected HGC27 cells and MKN74 cells. (d) Western blot showing the reduction of NT5E protein in sh-NC- or sh-circ_HN1-transduced HGC27 cells and MKN74 cells. (e) qRT-PCR of NT5E mRNA in 47 pairs of gastric cancer tissues and the matched normal gastric tissues. (f) Correlation between circ_HN1 and NT5E mRNA expression in 47 gastric primary tumors. (g) Western blot showing the overexpression of NT5E protein in gastric cancer tissues compared to the matched normal gastric tissues. *P < 0.05
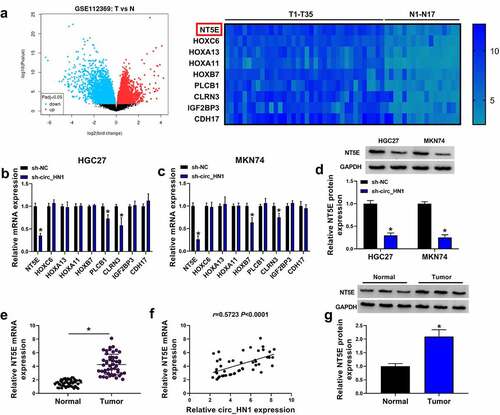
Figure 4. The effects of circ_HN1 knockdown are mediated by NT5E. Stable sh-NC- or sh-circ_HN1-infected HGC27 and MKN74 cells were introduced with pcDNA control plasmid or NT5E overexpressing plasmid. (a) NT5E mRNA level in transfected cells. (b) NT5E protein level in transfected cells. (c) A standard colony formation assay for colony formation ability of transfected cells. (d) Spheriod formation. Phase contrast micrographs of day 14 in ultra-low attachment plate culture. Proliferation of transfected cells by EdU (e) and MTT (f and g) assay. (h) PCNA protein expression in transfected cells by western blot. (i) Flow cytometry examining cell apoptosis rate. (j and k) Western blot of the Bcl-2 and Bax expression in transfected cells. Migration (l) and invasion (m) rates of transfected cells by transwell assay. *P < 0.05
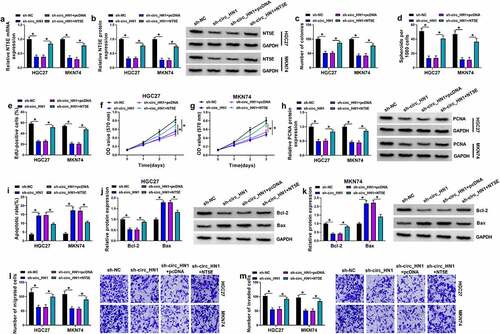
Figure 5. Circ_HN1 directly binds to miR-628-5p to up-regulate NT5E. (a) Venn diagram showing the 4 shared miRNAs of circ_HN1 and NT5E predicted by the computational program starBase. (b) qRT-PCR of the 4 shared miRNAs in HGC27, MKN74, and GES-1 cells. (c) Relative miR-628-5p expression in sh-NC- or sh-circ_HN1-transduced HGC27 and MKN74cells. (d) Predicted miR-628-5p pairing sites within circ_HN1, the mutant in the target sequence, and sequence of miR-628-5p. (e and f) Dual-luciferase reporter assays showing the validity of the miR-628-5p binding sites. (g) RNA pull-down assay performed with HGC27 and MKN74 cells using Bio-miR-NC, Bio-miR-628-5p WT or Bio-miR-628-5p MUT. (h) Predicted miR-628-5p binding sites within NT5E 3ʹUTR, the mutated seed sequence, and sequence of miR-628-5p. (i and j) Dual-luciferase reporter assays of NT5E 3ʹUTR predicted to be regulated by miR-628-5p. (k) qRT-PCR of miR-628-5p in 47 gastric cancer tissues and 47 matched normal gastric tissues. (l and m) Correlation between miR-628-5p and circ_HN1 or NT5E mRNA expression in 47 gastric primary tumors. qRT-PCR of miR-628-5p (n) and NT5E mRNA (o), and western blot of NT5E protein (p) in HGC27 and MKN74 cells transfected by anti-miR-628-5p, anti-miR-NC, miR-628-5p mimic, or miR-NC mimic. *P < 0.05
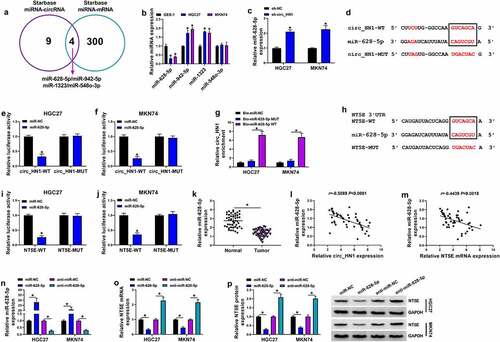
Figure 6. Circ_HN1 depletion exerts regulatory effects by up-regulating miR-628-5p. Stable sh-NC- or sh-circ_HN1-infected HGC27 and MKN74 cells were transfected with anti-miR-628-5p or anti-miR-NC. (a) MiR-628-5p expression in transfected cells. (b) Relative NT5E mRNA level in transfected cells gauged by qRT-PCR. (c) Western blot showing the level of NT5E protein. (d) Colony formation using a standard colony formation assay. (e) Spheriod formation. Phase contrast micrographs of day 14 in ultra-low attachment plate culture. Proliferation capacity of transfected cells examined by EdU (f) and MTT (g and h) assays. (i) Western blot of PCNA protein level in transfected HGC27 and MKN74 cells. (j) Apoptosis of transfected HGC27 and MKN74 cells by flow cytometry. (k and l) Western blot showing Bcl-2 and Bax levels in transfected HGC27 and MKN74 cells. (m and n) Representative images showing cell migration and invasion assays performed by transwell assay. *P < 0.05
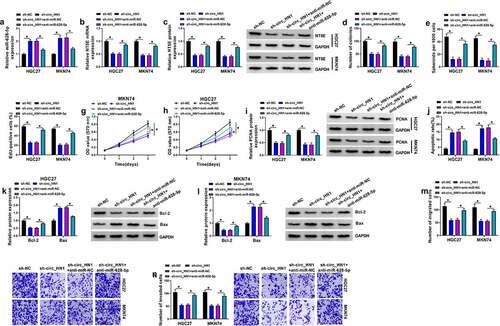
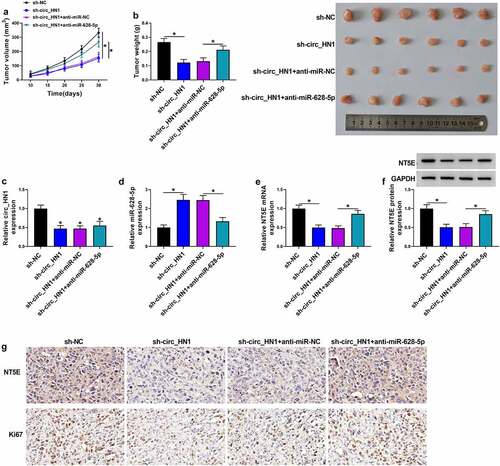
Figure 7. Knocking down circ_HN1 diminishes tumor growth in vivo. (a) Graphic representation of tumor volume of mice implanted with stable sh-NC- or sh-circ_HN1-infected HGC27 cells (n = 6 per group) and performed intratumor injection of PBS, anti-miR-NC or anti-miR-628-5p. (b) Images and mean weight of the xenograft tumors derived from sh-circ_HN1-transduced or sh-NC-infected HGC27 cells with intratumor injection of PBS, anti-miR-NC or anti-miR-628-5p at the end point (n = 6 per group). qRT-PCR of circ_HN1 (c), miR-628-5p (d), NT5E mRNA (e), and western blot of NT5E protein (f) in the sh-circ_HN1-transduced or sh-NC-infected HGC27 tumors with intratumor injection of PBS, anti-miR-NC or anti-miR-628-5p at day 30 after cell implantation. (g) Representative images showing NT5E and Ki67 staining of sections from sh-circ_HN1-transduced or sh-NC-infected HGC27 tumors with intratumor injection of PBS, anti-miR-NC or anti-miR-628-5p at the end of the experiments. *P < 0.05