
Figures & data
Table 1. The sequences of VDR, CYP27B1, TGFβ and GAPDH
Table 2. Basic information in the control, mild infectious pneumonia and severe infectious pneumonia cases
Table 3. Comparison of 25-OH-VD deficiency rate among the controls, mild infectious pneumonia and severe infectious pneumonia cases
Figure 1. The correlation between the levels of 25-OH-VD and Ca2+, PCT, CRP, and IL-6. (a) Statistical analysis of serum levels of 25-OH-VD, Ca2+, PCT, CRP, and IL-6 in the controls and mild and severe infectious pneumonia cases. (b) Correlations between the 25-OH-VD levels and four inflammatory indicators. ‘***’ p < 0.001 vs. control; ‘###’ p < 0.001 vs. mild pneumonia cases
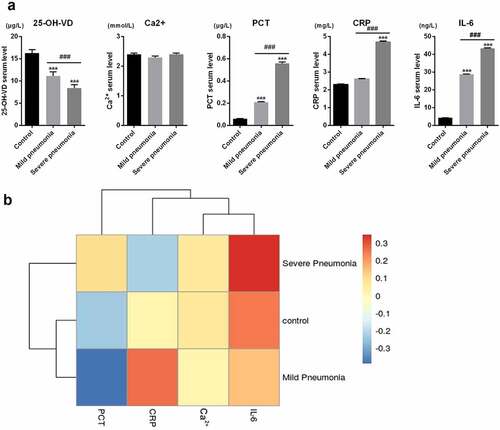
Table 4. Statistical analysis of serum levels of 25-OH-VD, Ca2+, PCT, CRP and IL-6 in the controls, mild infectious pneumonia and severe infectious pneumonia cases
Table 5. Correlations of 25-OH-VD with Ca2+, PCT, CRP and IL-6 among the neonates with infectious pneumonia
Figure 2. The analysis of TGFβ/YAP/TAZ pathway-related genes. (a) The mRNA expression levels of VDR and TGFβ in PBMCs, as determined using qRT-PCR. (b) Protein expression levels of VDR, TGFβ, n-YAP, and n-TAZ, as obtained using the western blot method. (c) Levels of inflammatory indicators IL-2, IFN-γ, TNFα and IL-1β, as determined using ELISA. NS, no significant difference with control; ‘*’ p < 0.05, ‘**’ p < 0.01, and ‘***’ p < 0.001 vs. control; ‘#’ p < 0.05, ‘##’ p < 0.01, and ‘###’ p < 0.001 vs. mild pneumonia cases
Figure 3. 25-OH-VD inhibited the nuclear translocation of YAP/TAZ complex. (a) Cellular viability of BEAS-2B cells, as determined using CCK8 assay. (b) mRNA expression levels of CYP27B1, VDR, and TGFβ, as detected using qRT-PCR. (c) The positive expression of YAP in nuclei, as detected using ICC and concluded in a histogram; Bar: 50 μm. (d) IFA was applied to confirm the nuclear translocation of YAP/TAZ complex in BEAS-2B cells; Bar: 20 µm. (e) Expression levels of IL-2, IFN-γ, TNF-α, and IL-1β, as determined using the western blot method. NS, no significant difference with control; ‘*’ p < 0.05, ‘**’ p < 0.01, and ‘***’ p < 0.001 vs. control; ‘@’ p < 0.05, ‘@@’ p < 0.01, and ‘@@@’ p < 0.001 vs. LPS group
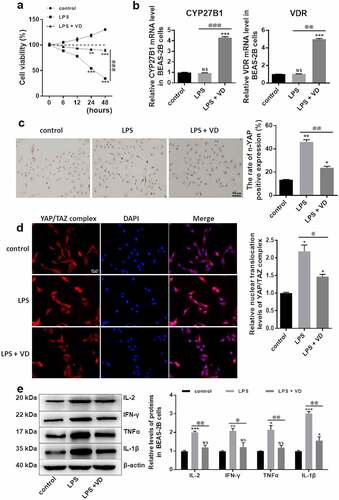
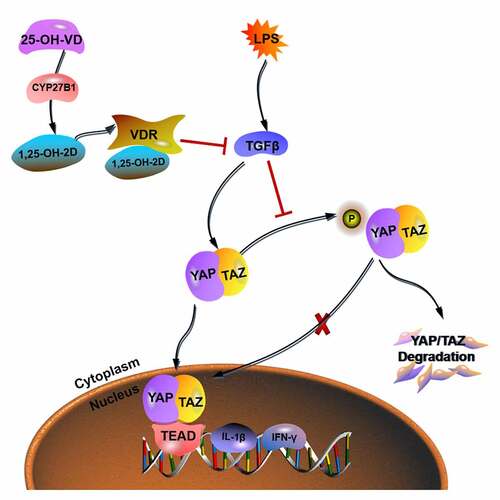
Figure 4. The anti-inflammatory mechanism of 25-OH-VD in NIP. When 25-OH-VD diffused into BEAS-2B cells, it was secondarily hydroxylated to generate 1,25-OH-2D under the action of CYP27B1 and combined with VDR to inhibit the activation and expression of TGFβ, thus reducing the nuclear translocation of YAP/TAZ complex. Once the YAP/TAZ complex was translocated into the nucleus, as the promoter, it participated in the expression levels of inflammatory factors (IL-2, TNF-α, IL-1β, and IFN-γ)
Availability of data and material
The analyzed data sets generated during the present study are available from the corresponding author on reasonable request.