
Figures & data
Table 1. List of primary antibodies used for western blots
Table 2. Primer sequences used for quantitative reverse transcription polymerase chain reaction (qRT-PCR)
Figure 1. Morphology and immune phenotype of adipose-derived stem cells (ADSCs) were identified by morphological observation and flow cytometry. (a) Morphology of the primary (P1) and third passage (P3) of ADSCs. Images were acquired at 200× magnification. (b) Immune phenotype of ADSCs. The average data from three independent experiments were shown as mean ± standard deviation
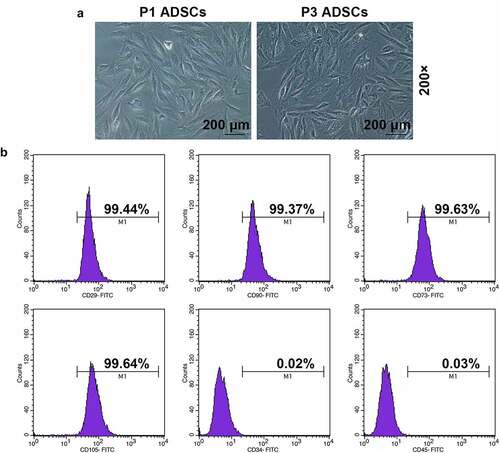
Figure 2. The promoting effect of velvet antler polypeptide (VAP) on the proliferation, migration and invasion rates of adipose-derived stem cells (ADSCs), as well as the angiogenesis rate of HUVECs following co-culture with ADSCs was detected. (a-d) Results from Cell Counting Kit-8 (CCK-8), colony formation, scratch wound healing, and transwell assays showed that VAP treatment generally dose-dependently promoted the viability (a), colony formation (b), migration (c) and invasion (d) rates of ADSCs, respectively. (e) Results from tube formation assay showed that VAP treatment generally dose-dependently promoted the angiogenesis rate of HUVECs following co-culture with ADSCs. Images were acquired at 100× and 250× magnification. The average data from three independent experiments were shown as mean ± standard deviation. *p < 0.05 or **p < 0.01 vs. 0 μg/mL VAP
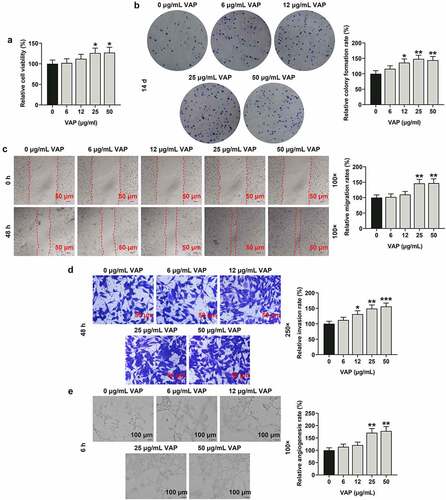
Figure 3. Velvet antler polypeptide (VAP) promoted the expressions of PI3K/Akt/HIF-1α signaling pathway-related molecules in adipose-derived stem cells (ADSCs). (a) Western blot analysis indicated the protein levels of PI3K, p-PI3K, Akt, p-Akt and HIF-1α. (b) Relative protein level of HIF-1α. (c) The ratio of p-PI3K to total PI3K protein (p-PI3K/PI3K). (d) The ratio of p-Akt to total Akt protein (p-Akt/Akt). β-actin was used as an internal control. Images were acquired at 100× magnification. The average data from three independent experiments were shown as mean ± standard deviation. *p < 0.05 or **p < 0.01 or ***p < 0.001 vs. 0 μg/mL VAP
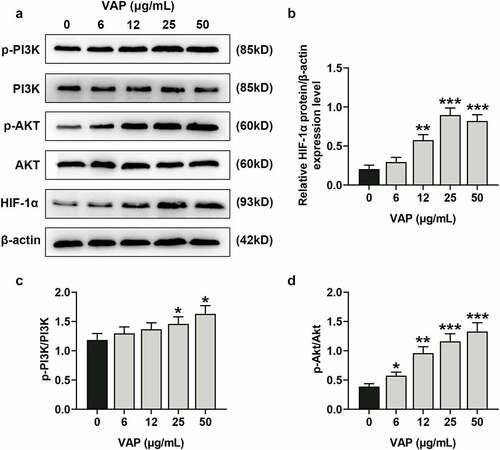
Figure 4. LY294002 and perifosine inhibited the promoting effect of velvet antler polypeptide (VAP) on the proliferation and migration of adipose-derived stem cells (ADSCs). (a-c) The viability (a), colony formation (b), and migration (c) rates of ADSCs in the control, VAP, VAP+LY294002, and VAP+perifosine groups were assessed by CCK-8, colony formation, scratch wound healing and transwell assays, respectively. The average data from three independent experiments were shown as mean ± standard deviation. *p < 0.05 or **p < 0.01 vs. Control; ##p < 0.01 vs. VAP
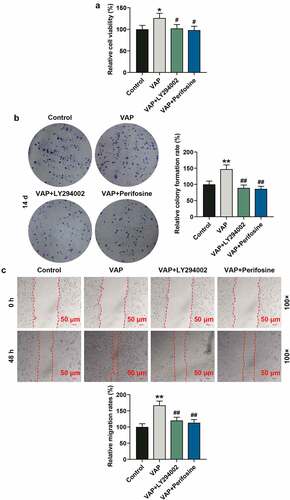
Figure 5. LY294002 and perifosine inhibited the promoting effect of velvet antler polypeptide (VAP) on the invasion of adipose-derived stem cells (ADSCs) and the angiogenesis rate of HUVECs following co-culture with ADSCs. (a) Invasion rates of ADSCs in the control, VAP, VAP+LY294002, and VAP+perifosine groups were determined by invasion assay. (b) Angiogenesis rates of HUVECs following co-culture with ADSCs in the control, VAP, VAP+LY294002, and VAP+perifosine groups were determined by tube formation assay. Images were acquired at 100× and 250× magnifications. The average data from three independent experiments were shown as mean ± standard deviation. **p < 0.01 or ***p < 0.001 vs. Control; ##p < 0.01 or ###p < 0.001 vs. VAP
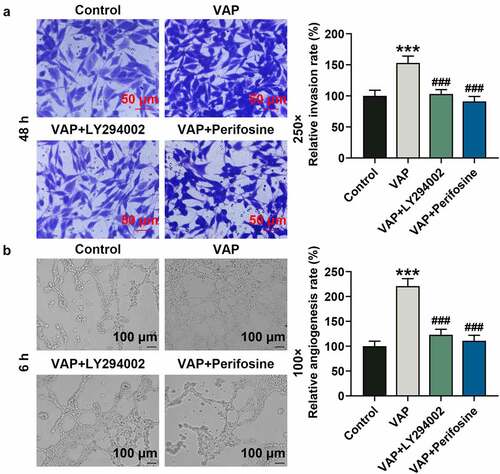
Figure 6. LY294002 and perifosine inhibited the promoting effect of velvet antler polypeptide (VAP) on the expressions of PI3K/Akt/HIF-1α signaling pathway-related molecules. (a) Western blot analysis indicated the protein levels of PI3K, p-PI3K, Akt, p-Akt and HIF-1α in the control, VAP, VAP+LY294002, and VAP+perifosine groups. (b) Relative protein level of HIF-1α. (c) The ratio of p-PI3K to total PI3K protein (p-PI3K/PI3K). (d) The ratio of p-Akt to total Akt protein (p-Akt/Akt). β-actin was used as an internal control. The average data from three independent experiments were shown as mean ± standard deviation. **p < 0.01 or ***p < 0.001 vs. Control; #p < 0.05 or ###p < 0.001 vs. VAP
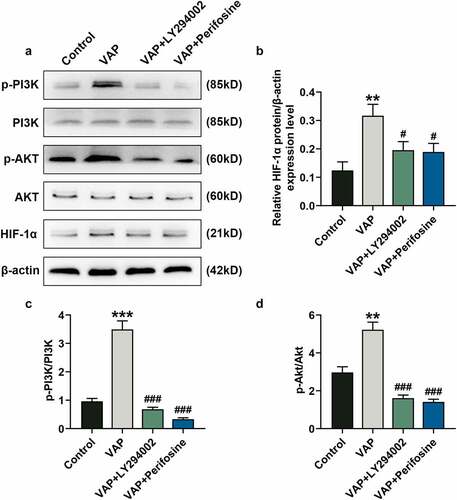
Figure 7. Velvet antler polypeptide (VAP)-PLGA promoted adipose-derived stem cell (ADSC)-induced wound healing in chronic skin ulcers in vivo. (a and b) The therapeutic effects of ADSCs or/and VAP (PLGA microspheres) on wound surface in chronic skin ulcers in vivo were evaluated by observing pathological changes on the 0, 14th, and 28th days. (a) The wound healing rate on the 28th day (b). The average data from three independent experiments were shown as mean ± standard deviation. *p < 0.05 or ***p < 0.001 vs. Blank; #p < 0.05 or ##p < 0.01 vs. Model; ^p < 0.05 vs. ADSCs; &p < 0.05 vs. VAP-PLGA
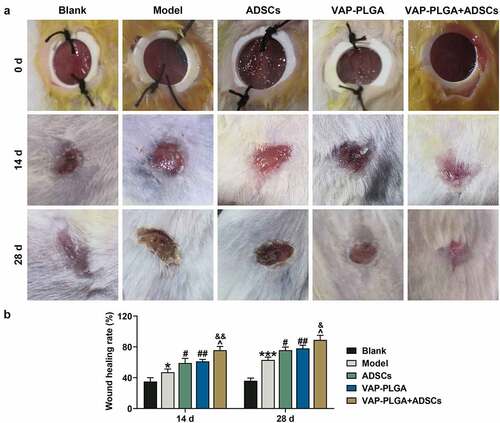
Figure 8. Velvet antler polypeptide (VAP)-PLGA promoted adipose-derived stem cell (ADSC)-induced wound healing in chronic skin ulcers in vivo. (a and b) Pathological changes (a) and capillary vessels (b) of wound tissue sections in the blank, model, ADSCs, VAP-PLGA, and VAP-PLGA +ADSCs groups were observed by HE staining and immunohistochemistry for CD31 respectively on the 28th day after treatment. Images were acquired at 100× and 200× magnifications. The average data from three independent experiments were shown as mean ± standard deviation. **p < 0.01 vs. Blank; ###p < 0.001 vs. Model; ^^p < 0.01 vs. ADSCs; &p < 0.05 vs. VAP-PLGA
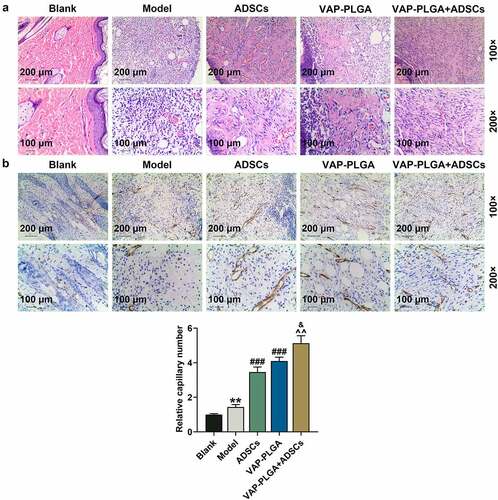
Figure 9. VAP-PLGA enhanced the promoting effect of adipose-derived stem cells (ADSCs) on the activation of PI3K/Akt/HIF-1α signaling pathway and VEGF expression in chronic skin ulcers in vivo. (a) Western blot analysis indicated the protein levels of p-PI3K, PI3K, p-Akt, Akt, HIF-1α, and VEGF in the blank, model, ADSCs, VAP-PLGA, and VAP-PLGA +ADSCs groups on the 28th day after treatment. (b) Relative protein level of HIF-1α. (c) Relative protein level of VEGF. (d) The ratio of p-PI3K to total PI3K protein (p-PI3K/PI3K) in the blank, model, ADSCs, VAP-PLGA, and VAP-PLGA +ADSCs groups. (e) The ratio of p-Akt to total Akt protein (p-Akt/Akt) in the blank, model, ADSCs, VAP-PLGA, and VAP-PLGA +ADSCs groups. β-actin was used as an internal control. The average data from three independent experiments were shown as mean ± standard deviation. *p < 0.05 vs. Blank; #p < 0.05 or ##p < 0.01 or ###p < 0.001 vs. Model; ^p < 0.05 or ^^p < 0.01 or ^^^p < 0.001 vs. ADSCs; &p < 0.05 or &&p < 0.01 vs. VAP-PLGA
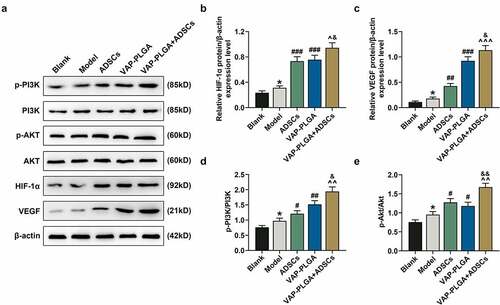
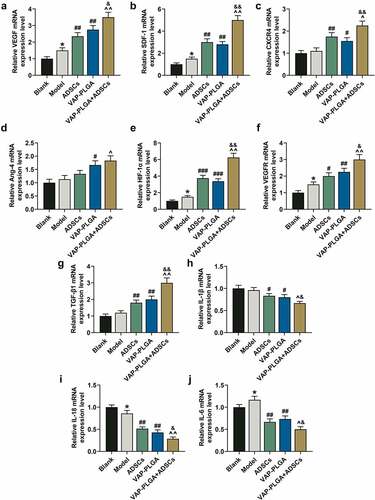
Figure 10. Velvet antler polypeptide (VAP)-PLGA enhanced the regulatory effect of adipose-derived stem cells (ADSCs) on the expressions of wound healing-related molecules and HIF-1α in chronic skin ulcers in vivo. QRT-PCR indicated the mRNA levels of VEGF (a), SDF-1 (b), CXCR4 (c), Ang-4 (d), HIF-1α (e), VEGFR (f), TGF-β1 (g), IL-1β (h), IL-18 (i), and IL-6 (j) in the blank, model, ADSCs, VAP-PLGA, and VAP-PLGA +ADSCs groups on the 28th day after treatment. β-actin was used as an internal control. The average data from three independent experiments were shown as mean ± standard deviation. *p < 0.05 vs. Blank; #p < 0.05 or ##p < 0.01 or ###p < 0.001 vs. Model; ^p < 0.05 or ^^p < 0.01 vs. ADSCs; &p < 0.05 or &&p < 0.01 vs. VAP. qRT-PCR: quantitative reverse transcriptase PCR; VEGF: vascular endothelial growth factor; SDF-1: stromal cell-derived factor-1; CXCR4: C-X-C motif chemokine receptor 4; Ang-4: angiopoietin-4; VEGFR: VEGF receptor; TGF-β1: transforming growth factor-β1; IL: interleukin
Supplemental Material
Download MS Excel (17 KB)Availability of Data and Materials
The analyzed data sets generated during the study are available from the corresponding author on reasonable request.