Figures & data
Table 1. The sequence of primer using in the study
Figure 1. Transcriptional profiles of TMED9 in BRCA and normal breast samples. (a) List of 33 cancer types (TCGA). Transcriptional patterns based on the (b) GSE15852, (c) GSE24124, (d) GSE33447, and (e) GSE53752 cohort. TCGA, the cancer genome atlas. *P < 0.05, **P < 0.01, ***P < 0.001
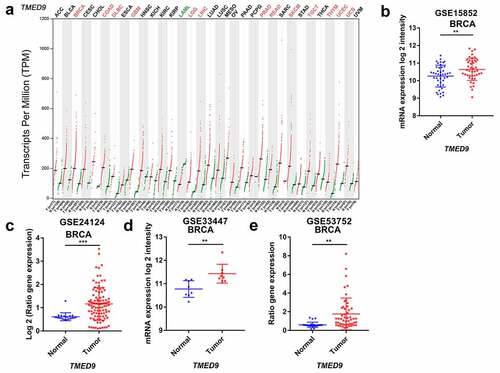
Figure 2. TMED9 protein expression profiles in BRCA and normal breast samples. Expression profiles based on the (a) HPA database and (b) CPTAC cohort. HPA, human protein atlas; CPTAC, Clinical proteomic tumor analysis consortium. ****P < 0.0001
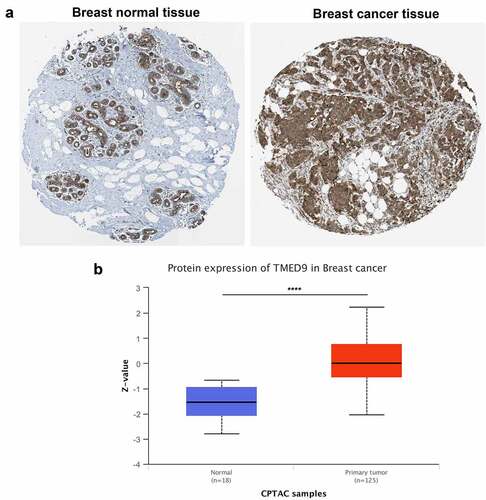
Figure 3. High TMED9 expression predicts poor prognosis in BRCA. (a) High expression of TMED9 predicted poor prognosis in BRCA, LGG, and LIHC as per the GEPIA database. (b-l) The correlations between the TMED9 expression and the survival of patients with BRCA were evaluated using data from different cohorts. The given Kaplan-Meier curves illustrate the probability of (b-c) overall survival (OS), using data from the (b) TCGA-BRCA and (c) GSE3143 cohort; (d) disease-free survival (DFS), based on data from the GSE4922 cohort; (e-f) disease-specific survival (DSS) based on the (e) GSE1456 cohort and the (f) GSE3494 cohort; (g-k) relapse-free survival (RFS) based on the (g) GSE1456, (h) GSE6532, (i) GSE12276, (j) GSE7390, and (k) GSE9195 cohorts; and (l) distant metastasis-free survival (DMFS) based on data from the GSE2034 cohort
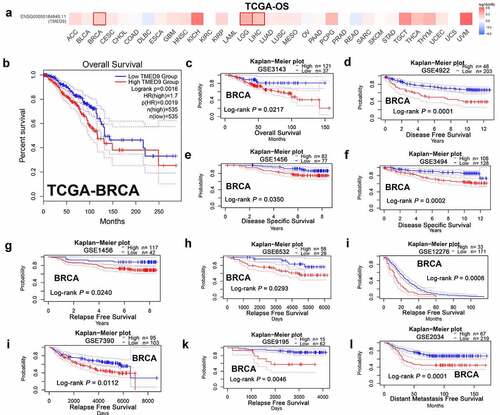
Figure 4. Validation of the expression patterns and prognostic implications of TMED9 in BRCA. (a) IHC staining for TMED9 in two representative BRCA cases. (b) Scatter plot of TMED IHC scores between BRCA and adjacent breast samples. (c) Kaplan-Meier analysis was utilized to compare the disease-free survival between BRCA patients with a high and low expression of TMED9. IHC, immunohistochemistry; ***P < 0.001
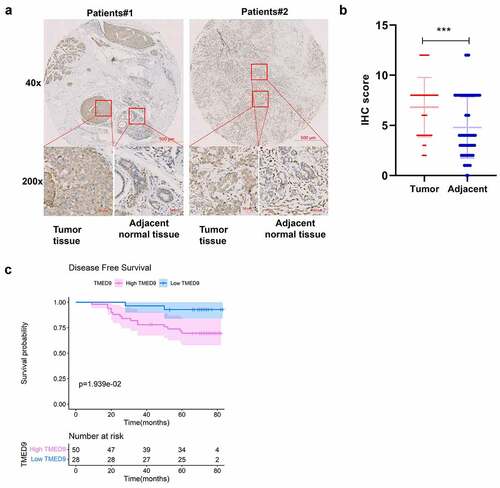
Figure 5. PPI network and functional annotation of TMED9 and its co-expressed genes. (a) PPI network combining TMED9 and its co-expressed genes. (b) GO and (c) KEGG analysis of the co-expressed genes. PPI, protein-protein network; GO, gene ontology; KEGG, Kyoto Encyclopedia of Genes and Genomes
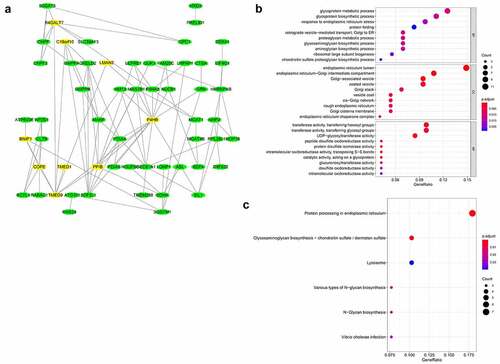
Figure 6. Correlations between TMED9 mRNA expression and drug sensitivity. (a) GDSC and (b) CTRP data for pan-cancer analysis. GDSC, genomics of drug sensitivity; CTRP, Genomics of therapeutics response portal; FDR, false discovery rate
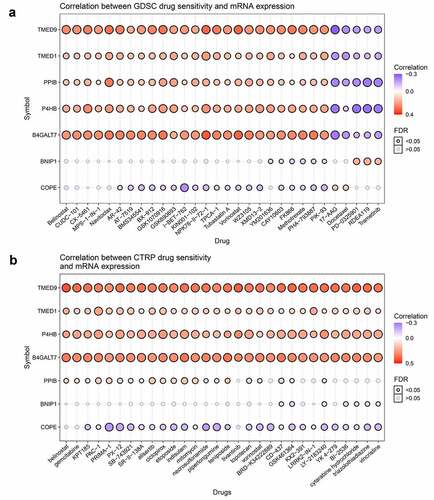
Figure 7. Probability of TMED9 dependency in BRCA cell lines
Figure 8. TMED9 knockdown suppresses BRCA cell proliferation. (a) Expression patterns of TMED9 protein in T47D, BT474, MCF-7, BT549, and MDA-MB-231 cells. (b) Knockdown efficiency of TMED9 in BT549 and MDA-MB-231 cells. (c) TMED9 knockdown decreased the viability of BT549 and MDA-MB-231 cells. (d) TMED9 knockdown suppressed the colony-forming abilities of MDA-MB-231 cells. (e) TMED9 knockdown increased the susceptibility of BT549 and MDA-MB-231 cells to gemcitabine. *P < 0.05, **P < 0.01, ***P < 0.001
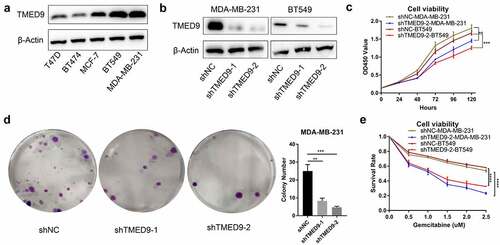
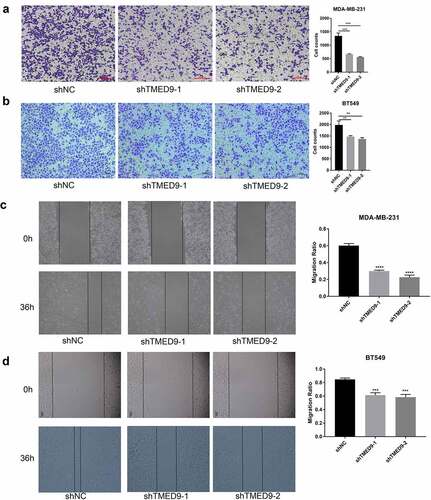
Figure 9. TMED9 knockdown suppresses BRCA cell migration. The transwell assay demonstrated that TMED9 knockdown suppressed the migration of (a) MDA-MB-231 and (b) BT549 cells. The wound healing assay showed that TMED9-knockdown (c) MDA-MB-231 and (d) BT549 cells suppressed migratory abilities. **P < 0.01, ***P < 0.001, ****P < 0.0001