Figures & data
Figure 1. circRNAs in β-TC6 cells treated with palmitic acid and stearic acid. (a) The number and type of circRNAs in the nine samples. (b) Circos plot showing the distribution of circRNAs in the nine samples on mouse chromosomes. C, control group; P, palmitic acid group; S, stearic acid group
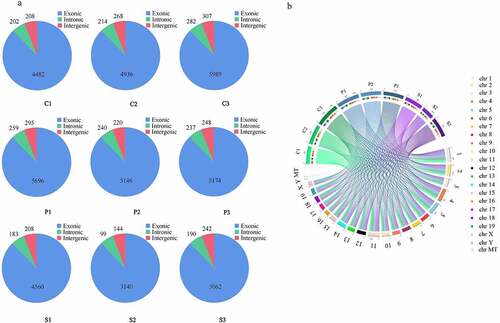
Figure 2. DEcircRNAs in β-TC6 cells analyzed by pairwise comparison. (a) Hierarchical clustering analysis of circRNAs in the three groups. (b–d) Volcano plots and histograms comparing DEcircRNAs in the palmitic acid and control group, stearic acid and control group, and stearic acid group and palmitic acid group. Red and blue points represent upregulated and downregulated circRNAs, respectively. P vs C, palmitic acid versus control group; S vs C, stearic acid versus control group; S vs P, stearic acid versus palmitic acid group
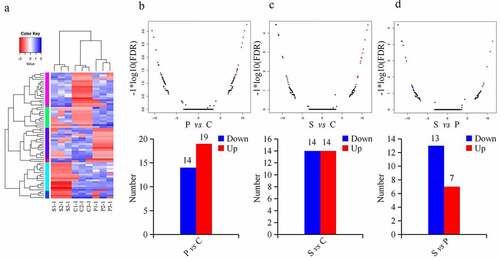
Table 1. The differential expressed circRNAs specific to palmitic acid-induced β-TC6 cells compared both with stearic acid and control group
Table 2. The differential expressed circRNAs specific to stearic acid-induced β-TC6 cells compared both with palmitic acid and control group
Table 3. The common differentially expressed circRNAs in stearic acid and palmitic acid group
Figure 3. Comparative analysis of DEcircRNAs between each group using a Venn diagram. (a–b) The number of circRNAs specific to the palmitic acid group and stearic acid group. (c) The number of commonly expressed circRNAs in both the palmitic acid and stearic acid groups. P vs C, palmitic acid versus control group; S vs C, stearic acid versus control group; S vs P, stearic acid versus palmitic acid group
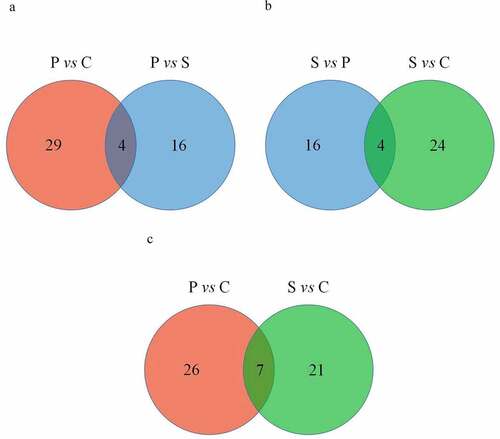
Figure 4. GO and KEGG pathway analyses of dysregulated mRNAs in the DEcircRNA-DEmiRNA-DEmRNA triple network. Top 20 enrichment GO terms of DEmRNAs in the palmitic acid group (a), stearic acid group (c) and the common to both palmitic acid and stearic acid group (e). The length of the bar represents the number of DEmRNAs. The color of the bar is related to the P-value with smaller P-values closer to red. Top 20 KEGG pathways of DEmRNAs in the palmitic acid group (b), stearic acid group (d) and the common to both palmitic acid and stearic acid group (f). The color of the bar is related to the P-value with smaller P-values closer to dark blue. PA, palmitic acid group; SA, stearic acid group
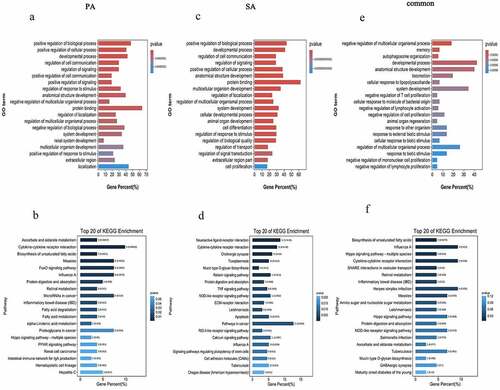
Figure 5. The DEcircRNAs-DEmiRNAs-DEmRNAs regulatory network. (a) View of the DEcircRNAs-DEmiRNAs-DEmRNAs network specific to the palmitic acid group. The network consists of 261 edges with three DEcircRNAs, two DEmiRNAs and 192 DEmRNAs. (b) In the stearic acid group, the preliminary DEcircRNAs-DEmiRNAs-DEmRNAs network consists of two circRNAs, four miRNAs, 456 genes and 644 edges. (c) DEcircRNAs-DEmiRNAs-DEmRNAs co-expression regulatory network in the common to both palmitic acid and stearic acid group. The red and blue nodes represent upregulated and downregulated DEmRNAs, respectively. Edges denote their relationship
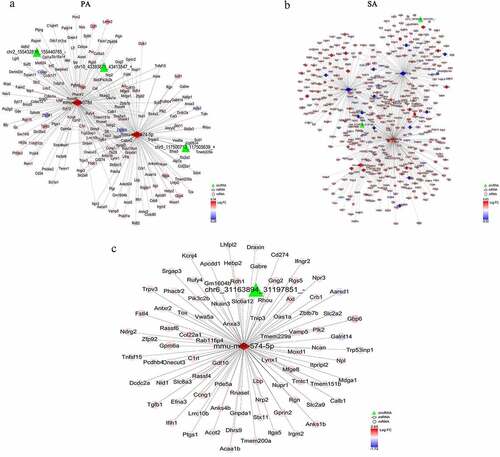
Table 4. Screening results of DEcircRNA-DEmRNA competing pairs in palmitic acid group
Table 5. Screening results of DEcircRNA-DEmRNA competing pairs in stearic acid group
Figure 6. DEcircRNAs related to the ceRNA regulatory network and functional analysis of the relevant DEmRNAs specific to the palmitic acid (a–c) and stearic acid groups (d–f). Green, red and blue nodes represent circRNAs, miRNAs and mRNAs in the network, respectively
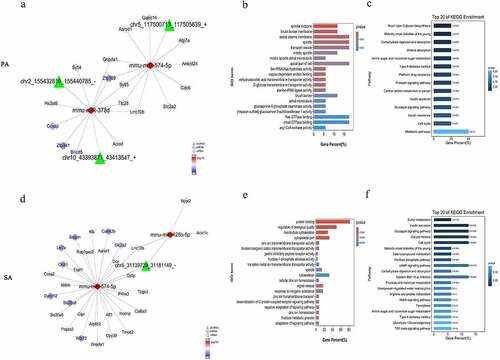
Figure 7. Validation of candidate circRNAs in β-TC6 cells by qPCR. (a) Expression of four DEcircRNAs specific to the palmitic acid group. (b) Expression of four DEcircRNAs specific to the stearic acid group. (c) Levels of the seven DEcircRNAs common to both the palmitic and stearic acid groups. **P < 0.01. n = 3 independent cell cultures per group. Ctrl, Control group; PA, palmitic acid group; SA, stearic acid group; NS, no significance