Figures & data
Table 1. Studies profiling the plasma exosomal miRNAs of patients with preeclampsia. PE: preeclampsia, EOPE: early onset preeclampsia, LOPE: late onset preeclampsia
Table 2. Clinical characteristics of enrolled patients. *: p-value<0.05. ALT: alanine aminotransferase; AST: aspartate aminotransferase
Table 3. Differentially expressed plasma exosomal miRNAs
Figure 1. Identification of isolated plasma exosomes. (a) TEM of exosomes. black arrow: exosomes. (b) particle diameters distribution of exosomes. (c) western blot of exosomal markers
Figure 2. Differentially expression analysis. (a) volcano plot of differentially expressed miRNAs. (b) heat map of differentially expressed miRNAs
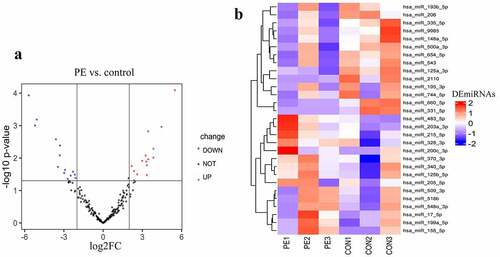
Figure 3. Gene set enrichment analysis. (a) gene ontology analysis of differentially expressed miRNAs. The left part of bar shows enrichment result about DEMirs, the right part shows top 10 enriched categories about UEMirs. (b) KEGG pathway analysis of UEMirs. Top 30 pathway terms were selected according to adjust p-value
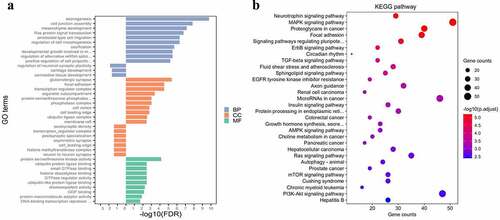
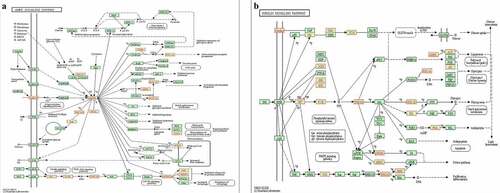
Figure 4. Two interested KEGG pathways. (a) AMPK signaling pathway. (b) insulin signaling pathway. The nodes highlighted in red indicate targets of UEMirs