Figures & data
Figure 1. rhADAMTS13 alleviated renal function damage in CP-induced AKI mice. (a). Serum levels of renal function indexes Scr and BUN were detected by the kits. n = 5. The histopathological changes of kidney were observed by HE (b) and PAS staining (c). n = 3. magnification×200.(d). Western blot detected the expression of KIM1 and NGAL. ***P < 0.001 vs control. #P < 0.05, ##P < 0.01, ###P < 0.001 vs CP
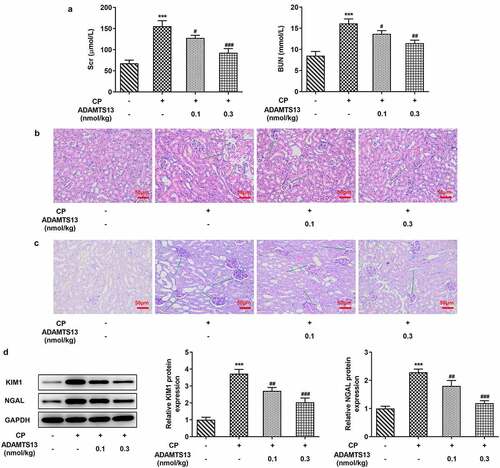
Figure 2. rhADAMTS13 alleviated ferroptosis in CP-induced AKI mice. (a). Perl’s staining was used to detect iron deposition in renal tissues. n = 3. (b). The kits detect total molten iron and Fe2+. magnification×200. n = 5. (c). Western blot were used to detect the expression of ferroptosis related proteins. n = 3. ***P < 0.001 vs control. #P < 0.05, ###P < 0.001 vs CP
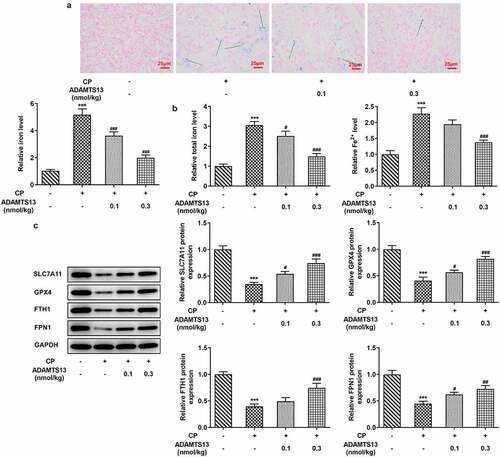
Figure 3. The expression of iron in the renal tissues of Fer-1 and Fe was given. (a). Perl’s staining was used to detect iron deposition in renal tissues after given with Fer-1 or Fe. n = 3. (b). The kits detect total molten iron and Fe2+ after given with Fer-1 or Fe. n = 5. (c). Western blot were used to detect the expression of ferroptosis related proteins after given with Fer-1 or Fe. n = 3. ***P < 0.001 vs control. ##P < 0.01, ###P < 0.001 vs CP. $p < 0.05, $$p < 0.01, $$$p < 0.001 vs CP + ADAMTS13
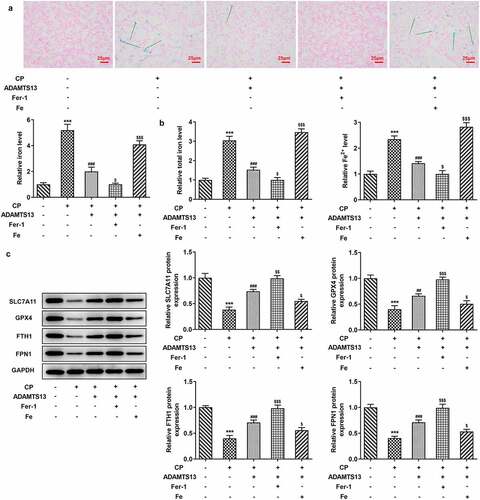
Figure 4. Fer-1 partially reversed CP induced AKI, while Fe increased AKI. (a). Serum levels of renal function indexes Scr and BUN were detected by the kits after given with Fer-1 or Fe. n = 5. The histopathological changes of kidney were observed by HE (b) and PAS staining (c) after given with Fer-1 or Fe. n = 3.(d). Western blot detected the expression of KIM1 and NGAL after given with Fer-1 or Fe. n = 3. ***P < 0.001 vs control. ###P < 0.001 vs CP. $p < 0.05, $$p < 0.01, $$$p < 0.001 vs CP + ADAMTS13
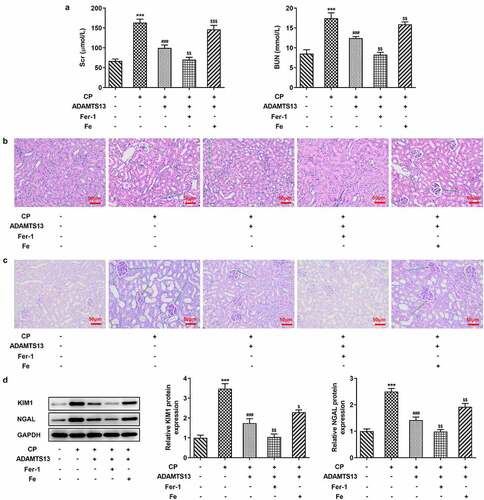
Figure 5. rhADAMTS13 alleviated inflammatory response and oxidative stress in CP-induced AKI mice. The levels of TNF-α, IL-1β, IL-6, MPO (a) and oxidative stress (b) in renal tissues were detected by ELISA. n = 5. ***P < 0.001 vs control. ###P < 0.001 vs CP. $p < 0.05, $$p < 0.01, $$$p < 0.001 vs CP + ADAMTS13
Figure 6. rhADAMTS13 regulated the NRF2 signaling pathway. Western blot detected the expression of nucleus Nrf2 and cytosol Nrf2 and HO-1. n = 3. ***P < 0.001 vs control. ###P < 0.001 vs CP. $p < 0.05, $$$p < 0.001 vs CP + ADAMTS13