
Figures & data
Figure 1. LncRNA PSMA3-AS1 level is enhanced in BC tissues and cells. (a) PSMA3-AS1 expression in BC tissues and normal tissues was detected by RT-qPCR. (b) kaplan–meier analysis was performed to investigate the relation between survival time of BC patients and PSMA3-AS1 expression. (c) PSMA3-AS1 expression in BC cells was detected by RT-qPCR. (d) ROC curve was used to evaluate the diagnostic value of PSMA3-AS1 in BC. *P < 0.05; **P < 0.01
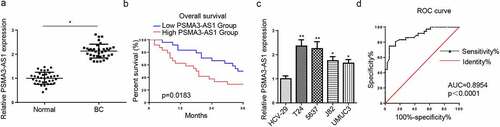
Figure 2. PSMA3-AS1 deletion represses the viability and metastasis of BC cells. T24 and 5637 cells were transfected with shPSMA3-AS1 or shNC, respectively. (a) The efficiency of PSMA3-AS1 knockdown was detected by RT-qPCR. (b) CCK-8 assay was applied to assess the viability of T24 and 5637 cells. (c and d) Wound healing and transwell assays to detect migration and invasion ability. (e) cell apoptosis was assessed by flow cytometry. (f)western blotting showed the protein levels of cleaved caspase-3. **P < 0.01. n = 3
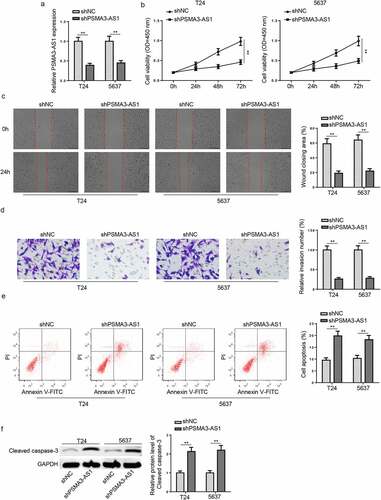
Figure 3. PSMA3-AS1 sponges miR-214-5p in BC. (a) subcellular localization of PSMA3-AS1 was determined in T24 and 5637 cells. (b) starbase software predicted the binding sites between miR-214-5p and PSMA3-AS1. (c) RIP assay was performed in T24 and 5637 cells to analyze the correlation between miR-214-5p and PSMA3-AS1. (d) T24 and 5637 cells were transfected with NC mimics or miR-214-5p mimics, respectively. the efficiency of miR-214-5p overexpression was detected by RT-qPCR. (e) THE association between miR-214-5p and PSMA3-AS1 was verified by luciferase reporter assay. (f) RNA pull-down assay was performed in T24 and 5637 cells. (g) MiR-214-5p expression in BC tissues and normal tissues was detected by RT-qPCR. (h) Pearson’s correlation analysis was used to analyze the correlation between miR-214-5p and PSMA3-AS1 levels in BC tissues. (i) MiR-214-5p expression in BC and normal cells was detected by RT-qPCR. (j) T24 and 5637 cells were transfected with shPSMA3-AS1 or shNC, respectively. MiR-214-5p expression in T24 and 5637 cells was detected by RT-qPCR. *P < 0.05; **P < 0.01, ***P < 0.001. n = 3
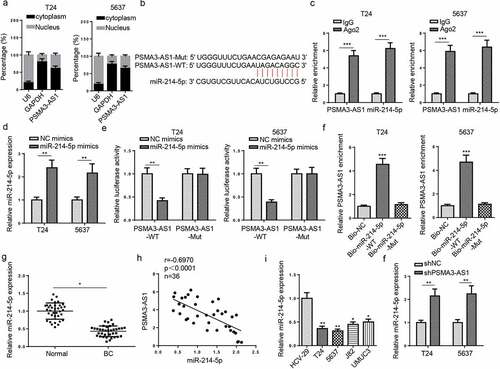
Figure 4. PSMA3-AS1 accelerates BC progression via modulating miR-214-5p. T24 and 5637 cells were transfected with miR-214-5p inhibitor or NC inhibitor, respectively. (a) The efficiency of miR-214-5p knockdown was detected by RT-qPCR. (b) CCK-8 assay was applied to assess the viability of T24 and 5637 cells. (c and d) wound healing and transwell assays to detect migration and invasion ability. (e) cell apoptosis was assessed by flow cytometry. (f)Western blotting showed the protein levels of cleaved caspase-3. *P < 0.05; **P < 0.01. n = 3
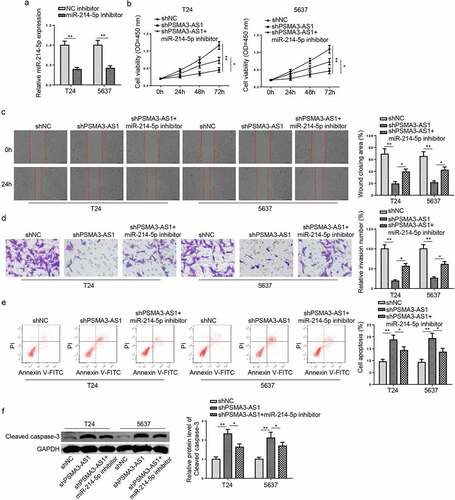
Figure 5. PD-L1 binds to miR-214-5p in BC cells. (a) Venn diagram of miR-214-5p targets predicted by miRanda, miRmap and RNA22 databases. (b and c) PD-L1 expression in BC and normal tissues and cells. (d) StarBase software predicted the binding sites between miR-214-5p and PD-L1. (e) The association between miR-214-5p and PD-L1 was verified by luciferase reporter assay. (f and g) RNA pull-down and RIP assays were detected in T24 and 5637 cells. (h) T24 and 5637 cells were transfected with NC mimics or miR-214-5p mimics. PD-L1 expression in T24 and 5637 cells was detected by RT-qPCR. (i) Pearson’s correlation analysis was used to analyze the correlation between miR-214-5p and PD-L1 levels in BC tissues. *P < 0.05; **P < 0.01, ***P < 0.001. n = 3
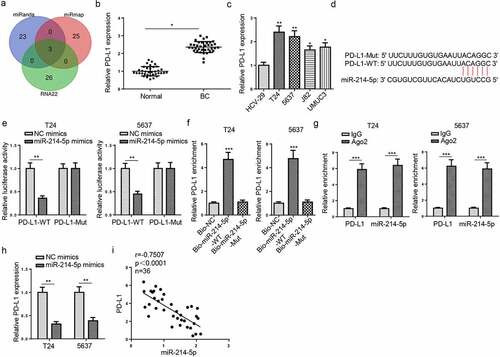
Figure 6. PSMA3-AS1 accelerates BC tumorigenesis in vitro via the miR-214-5p/PD-L1 axis. T24 and 5637 cells were transfected with shPD-L1 or shNC, respectively. (a) The efficiency of PD-L1 knockdown was detected by RT-qPCR. (b-e) CCK-8, wound healing, transwell and flow cytometry assays were applied to assess the viability, migration, invasion and apoptosis of T24 and 5637 cells. (f)western blotting showed the protein levels of cleaved caspase-3. (g) RT-qPCR assay was applied to measure PD-L1 expression in T24 and 5637 cells transfected with shNC, shPSMA3-AS1, shPSMA3-AS1+ miR-214-5p. (h) Pearson’s correlation analysis was used to analyze the correlation between PD-L1 and PSMA3-AS1 levels in BC tissues. *P < 0.05; **P < 0.01. n = 3
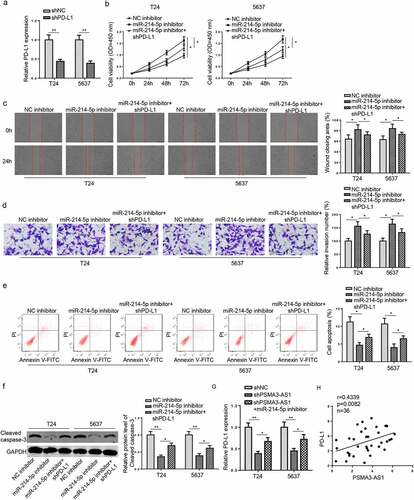
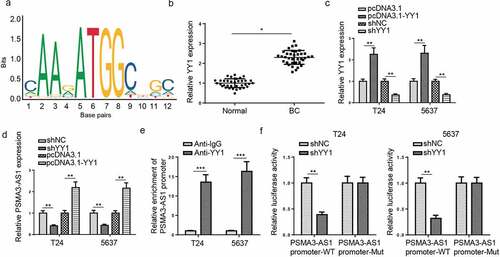
Figure 7. PSMA3-AS1 is activated by YY1 in BC. (a) The binding motif of YY1 and PSMA3-AS1 promoter was presented according to the data from JASPAR database. (b) YY1 expression in BC tissues and normal tissues was detected by RT-qPCR. (c) RT-qPCR showed that YY1 expression in T24 and 5637 cells transfected with shYY1 or shNC and pcDNA3.1 or pcDNA3.1/YY1. (d) RT-qPCR analysis showed PSMA3-AS1 expression in T24 and 5637 cells transfected with shYY1 or shNC and pcDNA3.1 or pcDNA3.1/YY1 (e) ChIP assays showed YY1 could bind to the PSMA3-AS1 promoter. (f) Luciferase reporter assay further confirmed the correlation between miR-214-5p and PSMA3-AS1. *P < 0.05; **P < 0.01, ***P < 0.001. n = 3
Data Availability
The datasets generated during and/or analyzed during the current study are available from the corresponding author on reasonable request.