Figures & data
Table 1. The sequences of the PCR primers in this study
Figure 1. The effects of miR-130a-3p and GCNT4 in gastric cancer were to be studied
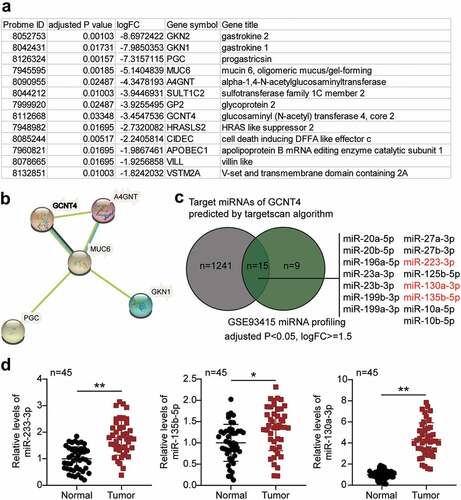
Figure 2. MiR-130a-3p promoted cell viability and proliferation of gastric cancer cells. (A) Measurement of miR-130a-3p expression in gastric cancer cell lines (HGC-27, MKN45 and AGS) and normal gastric epithelial GES-1 cells. (B) Measurement of miR-130a-3p expression in MKN45 and AGS cells transfected with NC and miR-130a-3p mimic by RT-qPCR. (C) Cell viability was detected in MKN45 and AGS cells transfected with miR-130a-3p mimic and NC by CCK-8 assay. (D) Cell proliferation was detected in MKN45 and AGS cells transfected with miR-130a-3p mimic and NC by BrdU assay. *, P < 0.05; **, P < 0.001. NC, negative control; mimic, miR-130a-3p mimic
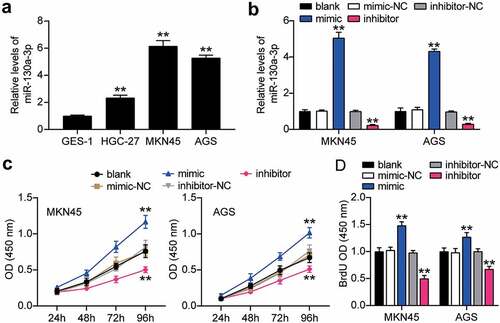
Figure 3. MiR-130a-3p enhanced cell migration and invasion of gastric cancer cells. (A) Cell migration level was determined in MKN45 and AGS cells transfected with NC and miR-130a-3p mimic by wound healing assay. (B) Cell invasion was detected in MKN45 and AGS cells transfected with miR-130a-3p mimic and NC by transwell assay. *, P < 0.05; **, P < 0.001. NC, negative control; mimic, miR-130a-3p mimic
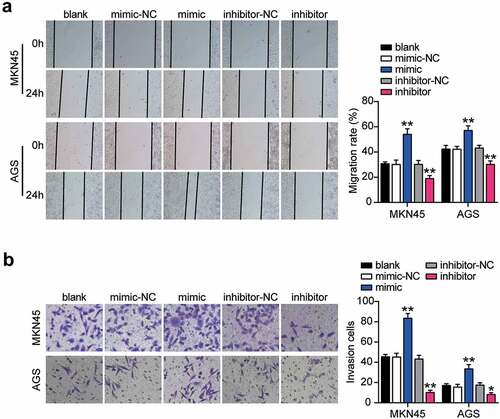
Figure 4. Interference with miR-130a-3p suppressed gastric cancer cell tumorigenicity in vivo. (a) Growth curves for tumor volumes in xenografts of nude mice in antagomiR and antagomiR-NC group. (b) Representative images of tumors in the antagomiR and antagomiR-NC groups. (c) Tumor weights of tumor tissue in antagomiR and antagomiR-NC group. *, P < 0.05; **, P < 0.001. NC, negative control; antago-miRNA, antago miR-130a-3p
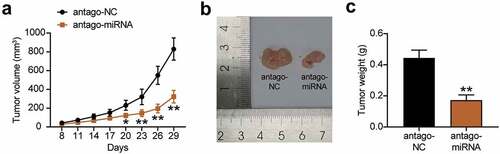
Figure 5. MiR-130a-3p targeting GCNT4 and inhibited the expression of GCNT4. (A) Bioinformatics analysis of the binding site sequence of miR-130a-3p and GCNT4 3ʹ-UTR. (B) Dual-luciferase assay was performed in cells co-transfected with plasmids GCNT4-WT or GCNT4-MUT and miR-NC or miR-130a-3p mimic in MKN45 and AGS cells. (C) RT-qPCR detection of expression of GCNT4 in MKN45 and AGS cells transfected with Bio- miR-130a-3p NC or Bio- miR-130a-3p mimic. (D) RT-qPCR detection of expression of GCNT4 in the gastric cancer tissues and normal tissues. (E) Wester blot detection of protein expression of GCNT4 in the gastric cancer tissues and normal tissues. (F) Measurement of GCNT4 expression in gastric cancer cells lines MKN45 and AGS and normal gastric epithelial GES-1 cells. (G) Correlation analysis between the miR-130a-3p expression and GCNT4 expression in gastric tumor tissues. *, P < 0.05; **, P < 0.001. WT, wild-type; MUT, mutant; NC, negative control
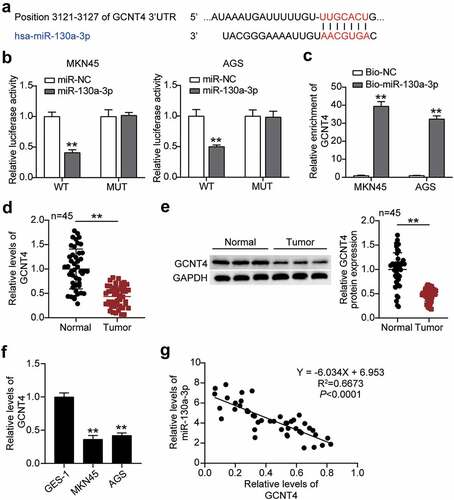
Figure 6. MiR-130a-3p targeting GCNT4 promoted gastric cancer cells growth. (A) Measurement of GCNT4 protein expression in MKN45 and AGS cells transfected with mimic-NC, empty vector, mimic, OE, and OE+ mimic by western blot. (B) Cell viability was detected in MKN45 and AGS cells transfected with mimic-NC, empty vector, mimic, OE, and OE+ mimic by CCK-8 assay. (C) Cell proliferation was detected in MKN45 and AGS cells transfected with mimic-NC, empty vector, mimic, OE, and OE+ mimic by BrdU assay. *, P < 0.05; **, P < 0.001 compared with blank; #, P < 0.05; ##, P < 0.001 compared with OE+ mimic. NC, negative control; OE, overexpression-GCNT4; mimic, miR-130a-3p mimic; OE+ mimic, overexpression-GCNT4 + miR-130a-3p mimic
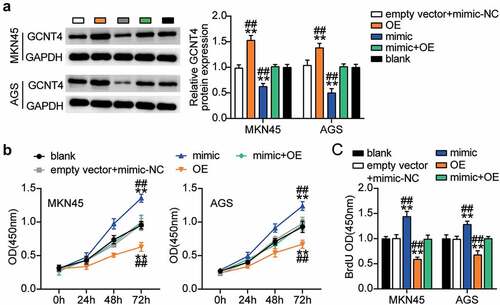
Figure 7. MiR-130a-3p targeting GCNT4 enhanced cell migration and invasion of gastric cancer cells
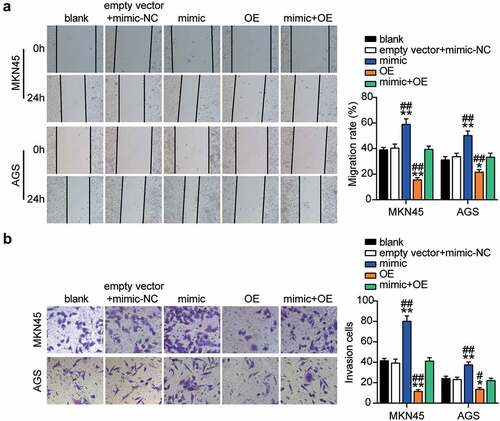
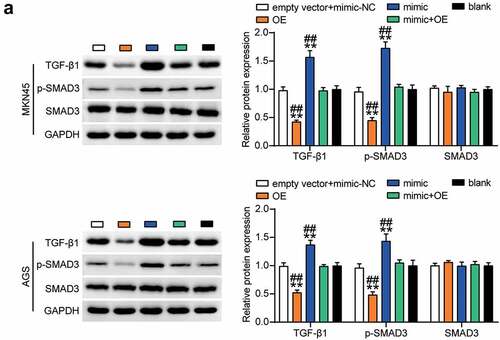
Figure 8. The TGF-β1 and p-smad3 protein expression was detected in MKN45 and AGS cells transfected with mimic-NC, empty vector, mimic, OE, and OE+ mimic by western blot assay. *, P < 0.05; **, P < 0.001 compared with blank; #, P < 0.05; ##, P < 0.001 compared with OE+ mimic. NC, negative control; OE, overexpression-GCNT4; mimic, miR-130a-3p mimic; OE+ mimic, overexpression-GCNT4 + miR-130a-3p mimic