
Figures & data
Table 1. Sequence of PCR primers used in this study
Figure 1. PYCR1 and hsa-miR-150-5p were selected to be studied in this research
(a) The significantly upregulated genes in NPC in GSE64634 data. Five genes were identified. Selection criteria: adjusted P < 0.05, logFC≥1.5. (b–f) The expression of the five genes in GEPIA HNSC data. HNSC: head and neck squamous cell carcinoma. (g) RT-qPCR analysis of SAC3D1 and PYCR1 expression in NPC tissues and normal tissues. n = 38. **, P < 0.001. (h) The candidate miRNA that both targets PYCR1 mRNA and significantly downregulates in NPC (data from GSE118613 data analysis).
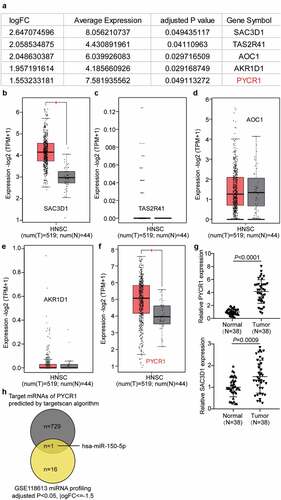
Figure 2. Hsa-miR-150-5p inhibited NPC cells viability and proliferation
(a)RT-qPCR detection of hsa-miR-150-5p expression in NPC tissues and normal tissues. n = 38. **, P < 0.001. (b) RT-qPCR detection of hsa-miR-150-5p expression in NPC cells lines (TW03, C666-1 and SUNE-1) and normal cell (NP69). **, P < 0.001 compared with NP69. (c) Measurement of hsa-miR-150-5p expression in C666-1 and SUNE-1 cells transfected with mimic-NC and hsa-miR-150-5p mimic by RT-qPCR. (d) Cell viability was detected in C666-1 and SUNE-1 cells transfected with mimic-NC and hsa-miR-150-5p mimic by CCK-8 assay. (e) Cell proliferation was detected in C666-1 and SUNE-1 cells transfected with mimic-NC and hsa-miR-150-5p mimic. (f) Bax and Bcl-2 protein expression was detected in C666-1 and SUNE-1 cells transfected with e mimic-NC and hsa-miR-150-5p mimic by western blot assay. n = 3. *, P < 0.05; **, P < 0.001 compared with blank. NC, negative control; mimic, hsa-miR-150-5p mimic.
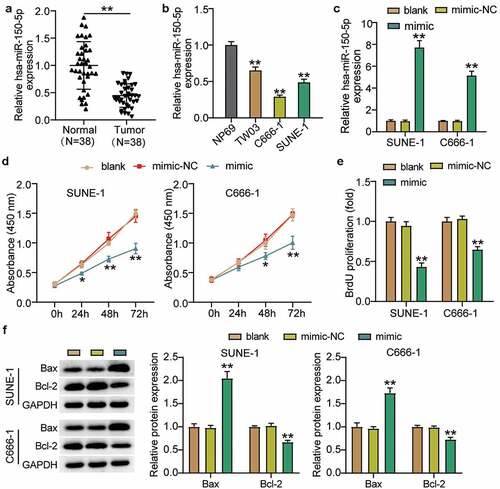
Figure 3. Hsa-miR-150-5p inhibited cell migration and invasion of NPC cells
(a) Cell migration was detected in C666-1 and SUNE-1 cells transfected with mimic-NC and hsa-miR-150-5p mimic. (b) Cell invasion was detected in C666-1 and SUNE-1 cells transfected with mimic-NC and hsa-miR-150-5p mimic. n = 3. **, P < 0.001 compared with blank. NC, negative control; mimic, hsa-miR-150-5p mimic.
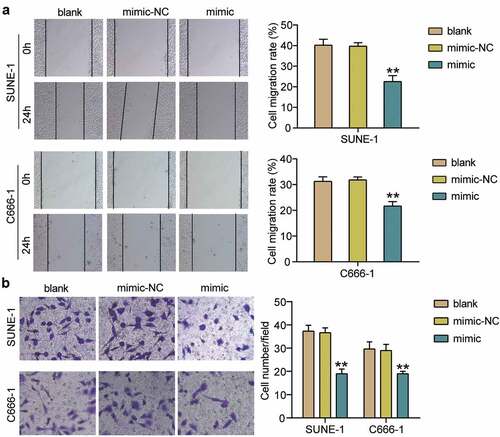
Figure 4. PYCR1 was a target of hsa-miR-150-5p
(a) Bioinformatics analysis showed the predicted binding sequence of PYCR1 3ʹ-UTR. (b) Dual luciferase assay was performed in cells co-transfected with plasmids PYCR1-WT or PYCR1-MUT and miR-NC or hsa-miR-150-5p mimic in C666-1 and SUNE-1 cells. **, P < 0.001 compared with miR-NC. (c) RNA pull-down analysis of PYCR1 expression in C666-1 and SUNE-1 cells. **, P < 0.001 compared with Bio-NC. (d) Association of hsa-miR-150-5p and PYCR1 expression levels with AGO2 were determined by RIP-western blotting with AGO2 antibody and RT-qPCR used for RIP analysis as compared with IgG group. **, P < 0.001. (e) RT-qPCR detection of expression of PYCR1 in the NPC C666-1 and SUNE-1 cells and NP69cells. **, P < 0.001 compared with NP69. (f) Correlation analysis between the hsa-miR-150-5p expression and expression in the NPC tumor tissues. n = 3. WT, wild-type; MUT, mutant; NC, negative control.
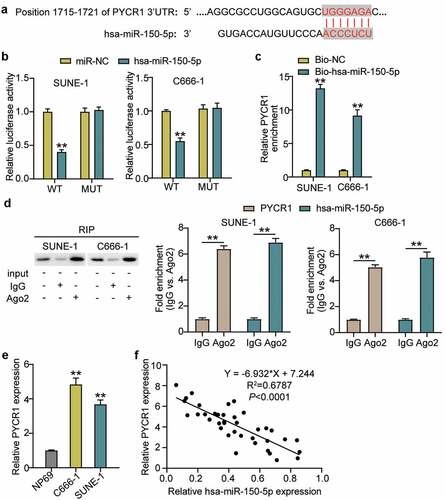
Figure 5. Hsa-miR-150-5p targeting PYCR1 repressed cell proliferation, but enhanced cell apoptosis of NPC cells
(a) Measurement of PYCR1 protein expression in C666-1 and SUNE-1 cells transfected with empty vector+mimic-NC, OE, mimic and mimic+ OE by western blot. (b) Cell viability was detected in C666-1 and SUNE-1 cells transfected with empty vector+mimic-NC, OE, mimic and mimic+ OE by CCK-8 assay. (c) Cell proliferation was detected in C666-1 and SUNE-1 cells transfected with empty vector+mimic-NC, OE, mimic and mimic+ OE by BrdU assay. (d) Bax and Bcl-2 protein expression was detected in C666-1 and SUNE-1 cells transfected with empty vector+mimic-NC, OE, mimic and mimic+ OE by western blot assay. n = 3. *, P < 0.05; **, P < 0.001 compared with blank. #, P < 0.05; ##, P < 0.001 compared with mimic+ OE. NC, negative control; mimic, hsa-miR-150-5p mimic; OE, PYCR1 overexpression; mimic+OE, hsa-miR-150-5p mimic+ PYCR1 overexpression.
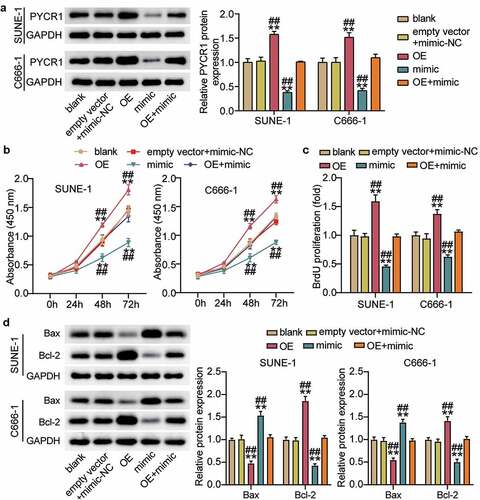
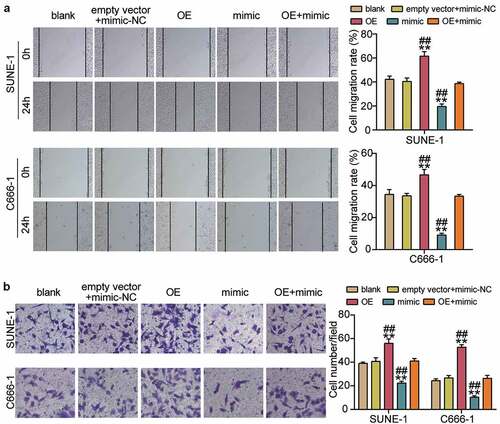
Figure 6. Hsa-miR-150-5p targeting PYCR1 suppressed cell migration and invasion of NPC cells
(a) Cell migration was detected in C666-1 and SUNE-1 cells transfected with empty vector+mimic-NC, OE, mimic, and mimic+ OE by BrdU assay. (b) Cell invasion was determined in C666-1 and SUNE-1 cells transfected with empty vector+mimic-NC, OE, mimic, and mimic+ OE. n = 3. *, P < 0.05; **, P < 0.001 compared with blank. #, P < 0.05; ##, P < 0.001 compared with mimic+ OE. NC, negative control; mimic, hsa-miR-150-5p mimic; OE, PYCR1 overexpression; mimic+ OE, hsa-miR-150-5p mimic+ PYCR1 overexpression.
Supplemental material