
Figures & data
Table 1. Primer sequences for RT-PCR
Figure 1. Neurons in brain tissue were damaged in HIE model rats. (a): Longa score of each group of rats, N = 12; (b–d): The central residence time, total distance and feces number of rats in each group in the OFT, N = 12; (e–f): The escape latency and times of crossing the original target platform area in the MWM experiment of rats in each group, N = 12; (g): rat model of HIE was established. (h): HE staining of cerebral cortex of rats in each group, N = 6; (i): Nissl staining of cerebral cortex of rats in each group, N = 6; (d–e): TUNEL staining of the left hippocampus of rats in each group, N = 6. Data were presented as mean ± standard deviation, one-way repeated measurement ANOVA was used in Figure A and Figure E, and unpaired t test was used for data comparison between other groups. * P < 0.05; ** P < 0.01, compared with the sham group
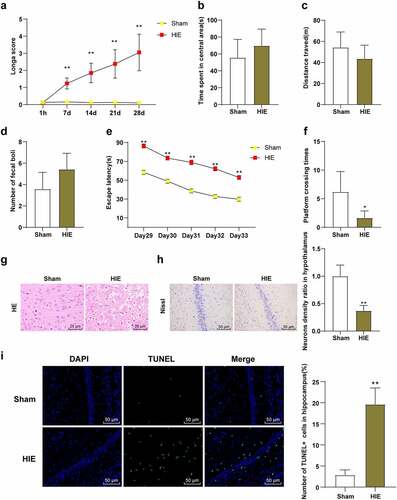
Figure 2. SF post-treatment alleviated neuronal injury in HIE rat model. A rat model of HIE was established and post-treated with SF. (a): Longa score of rats in each group, N = 12; (b–d): The central residence time, total distance and feces number of each group in OFT, N = 12; (e–f): The escaping latency and the times of crossing the original target platform area in the MWM experiment of rats in each group, N = 12. (g): HE staining of cerebral cortex of rats in each group, N = 6; (h): Nissl staining of cerebral cortex of rats in each group, N = 6; (i): TUNEL staining of the left hippocampus of rats in each group, N = 6. Data were presented as mean ± standard deviation, one-way repeated measurement ANOVA was used in Figure A and Figure E, and unpaired t test was used for data comparison between other groups. * P < 0.05; ** P < 0.01, compared with the HIE group
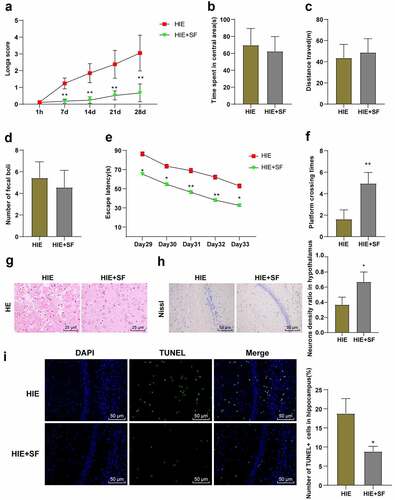
Figure 3. SF post-treatment decreased the levels of G9a and H3K9me2 in the brain tissues of HIE rats. A rat model of HIE was established and post-treated with SF. (a): The mRNA level of G9a in brain tissue of rats in each group was detected by RT-PCR; (b): The levels of G9a and H3K9me2 in brain tissues of rats in each group were determined by WB. (c): The contents of NGF and BDNF in brain tissue of rats in each group were determined by ELISA. N = 6, data were presented as mean ± standard deviation, one-way ANOVA analysis was used for data comparison between groups, and Tukey’s test was used for the post hoc test. * P < 0.05; ** P < 0.01, compared with sham group; # P < 0.05, ## P < 0.01, compared with the HIE group
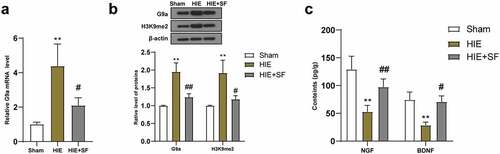
Figure 4. SF post-treatment mediated G9a to reduce BDNF gene promoter H3K9me2 and increase BDNF level. The OGD cell model was established in vitro and the OGD cells treated with SF were transfected with AAV-G9A. (a): The mRNA level of G9a was detected by RT-PCR. (b): WB was used to determine the level of G9a in each group. (c): The enrichment level of H3K9me2 in the promoter region of BDNF gene was detected by CHIP. (d): The content of BDNF in each group was determined by ELISA. Then, rats were infected with AAV-G9a vector, and a rat model of HIE was established and post-treated with SF. (e): The mRNA expression of G9a in each group was detected by RT-PCR. (f): The expression of G9a in each group was determined by WB. (g): The enrichment level of H3K9me2 on BDNF gene promoter region was detected by CHIP. He: The content of BDNF in each group was determined by ELISA. N = 6, the cell experiment was repeated three times, data were presented as mean ± standard deviation, one-way ANOVA analysis was used for data comparison between groups, and Tukey’s test was used for the post hoc test. * P < 0.05, ** P < 0.01
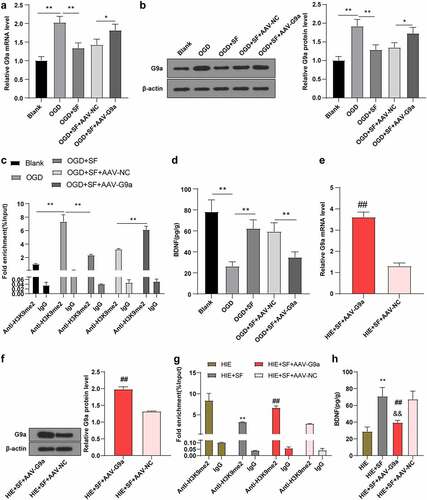
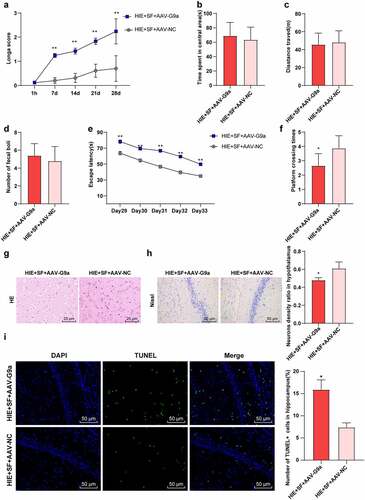
Figure 5. SF post-treatment mediated G9a to reduce HIE in rats. Rats were infected with AAV-G9a vector, and a rat model of HIE was established and post-treated with SF. (a): Longa score of rats in each group, N = 12; (b–d): The central residence time, total distance and feces number of each group in OFT, N = 12; (e–f): The escaping latency and times of crossing the original target platform region in the MWM experiment of rats in each group. (g): HE staining of cerebral cortex of rats in each group, N = 6; (h): Nissl staining of cerebral cortex of rats in each group, N = 6; (i): TUNEL staining of the left hippocampus of rats in each group, N = 6; N = 12. Data were presented as mean ± standard deviation, one-way repeated measurement ANOVA was used in Figure A and Figure E, and unpaired t test was used for data comparison between other groups, * P < 0.05; ** P < 0.01, compared with the HIE + SF + AAV-NC
Availability of data and materials
All the data generated or analyzed during this study are included in this published article.