Figures & data
Table 1. Gene sequence primers.
Figure 1. LncRNA AGAP2-AS1 was highly expressed in glioma tissues and cell lines. (a) AGAP2-AS1 expression in 60 glioma tissues and 60 normal samples was assessed by quantitative real-time polymerase chain reaction (qRT-PCR). Glyceraldehyde-3-phosphate dehydrogenase (GAPDH) was used as the internal control. **P< 0.01 vs. Normal group. (b) AGAP2-AS1 expression in different grades of glioma was quantified by qRT-PCR (WHO I group, n = 6; WHO II group, n = 19; WHO III group, n = 21; WHO IV group, n = 14). GAPDH was served as the internal control. **P< 0.01 vs. WHO I group; ##P< 0.01 vs. WHO II group. (c) The expression of AGAP2-AS1 in glioma cell lines and normal human astrocyte cell line (HEB) was measured by qRT-PCR, with GAPDH as the internal control. **P< 0.01 vs. HEB group. All experiments were performed in triplicate and data were expressed as mean ± standard deviation (SD).
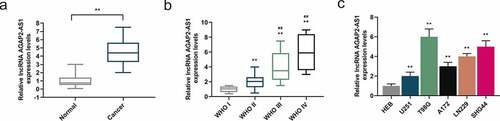
Figure 2. Knockdown of AGAP2-AS1 inhibited proliferation of glioma cells. (a-b) The expression of AGAP2-AS1 in U251 and T98G cells transfected with small interfering RNA targeting AGAP2-AS1 (siAGAP2-AS1) or its negative control (siNC) was evaluated by qRT-PCR assay. GAPDH was utilized as the internal control. (c-d) The viability of U251 and T98G cells was determined by Cell Counting Kit-8 (CCK-8) assay. (e-f) The proliferation of U251 and T98G cells was determined by colony formation assay. **P< 0.01 vs. siNC group. All experiments were performed in triplicate and data were presented as mean ± SD.
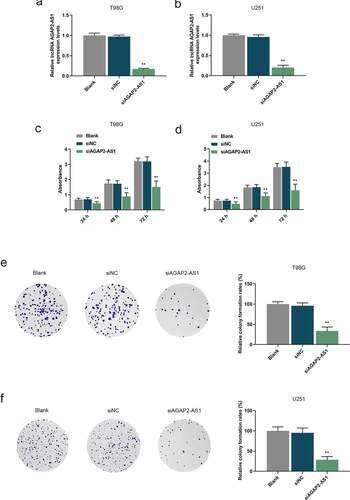
Figure 3. Knockdown of AGAP2-AS1 repressed migration and invasion of glioma cells. (a-b) The migration abilities in U251 and T98G cells were examined by wound healing assay (magnification 100×, scale bar = 100 µm). (c, d) The invasion abilities in U251 and T98G cells after transfection were evaluated by transwell assay (magnification 200×, scale bar = 50 µm). **P< 0.01 vs. siNC group. All experiments were performed in triplicate and data were expressed as mean ± SD.
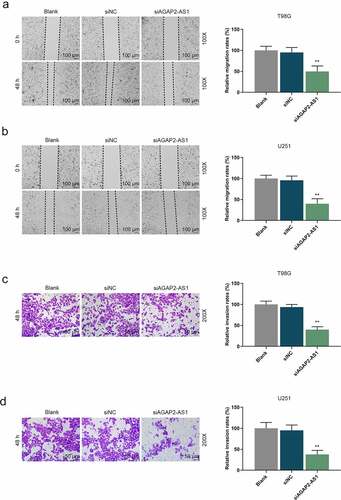
Figure 4. Knockdown of AGAP2-AS1 restrained epithelial-mesenchymal transition (EMT) of glioma cells. (a-b) Western blot was conducted to detect the expressions of EMT-related markers, with GAPDH as the internal control. **P< 0.01 vs. siNC group. All experiments were performed in triplicate and data were expressed as mean ± SD.
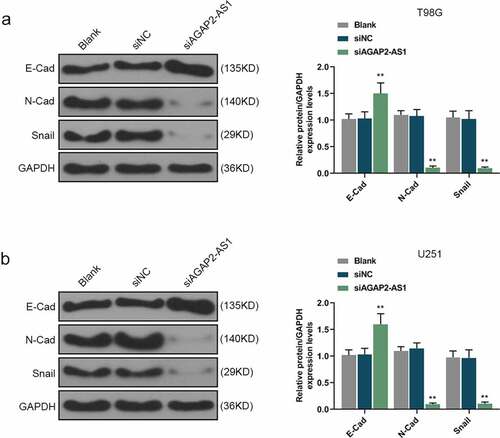
Figure 5. AGAP2-AS1 targeted miR-497-5p and downregulation of miR-497-5p was observed in glioma tissues and cells. (a) The binding sites between AGAP2-AS1 and miR-497-5p were predicted by starBase (http://starbase.sysu.edu.cn/index.php). (b-c) To estimate the interaction between AGAP2-AS1 and miR-497-5p, dual-luciferase reporter assay was implemented. **P< 0.01 vs. Blank group. (d) MiR-497-5p expression in 60 glioma tissues and 60 normal samples was assessed by qRT-PCR assay. U6 was utilized as the internal control. **P< 0.01 vs. Normal group. (e) MiR-497-5p expression in different grades of glioma was quantified by qRT-PCR (WHO I group, n = 6; WHO II group, n = 19; WHO III group, n = 21; WHO IV group, n = 14). U6 acted as the internal control. **P< 0.01 vs. WHO I group; ##P< 0.01 vs. WHO II group. (f) MiR-497-5p expression in glioma cell lines and HEB cells was measured by qRT-PCR, with U6 as the internal control. **P< 0.01 vs. HEB group. (g-h) MiR-497-5p expression in glioma cells transfected with siAGAP2-AS1 or siNC was evaluated by qRT-PCR assay. U6 was used as the internal control. **P< 0.01 vs. siNC group. All experiments were performed in triplicate and data were expressed as mean ± SD.
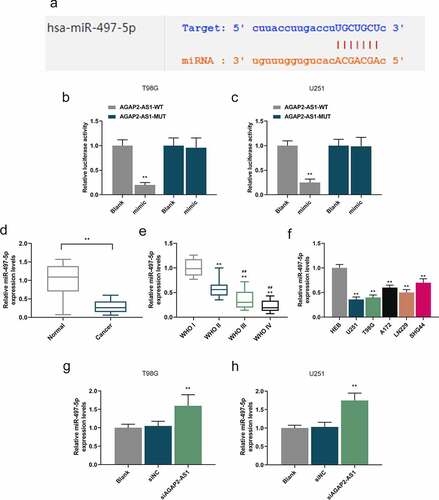
Figure 6. AGAP2-AS1 facilitated the glioma cell viability and proliferation by targeting miR-497-5p. (a-b) U251 and T98G cells were transfected with miR-497-5p mimic (m), miR-497-5p inhibitor (i) or siAGAP2-AS1 and the expression level of miR-497-5p in U251 and T98G cells was determined by qRT-PCR assay. U6 was served as the internal control. (c-f) The viability and proliferation of U251 and T98G cells after transfection were assessed by CCK-8 and colony formation assays. **P< 0.01 vs. MC group, ##P< 0.01 vs. IC group, ^^P< 0.01 vs. I group. All experiments were performed in triplicate and data were expressed as mean ± SD.
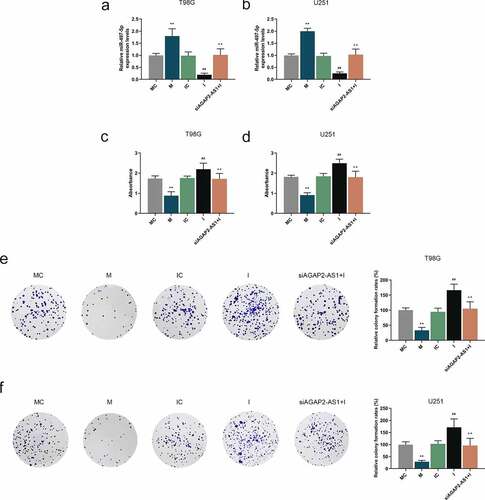
Figure 7. AGAP2-AS1 facilitated the glioma cell migration and invasion by targeting miR-497-5p. (a-b) U251 and T98G cells were transfected with miR-497-5p M, miR-497-5p I or siAGAP2-AS1 and the migration abilities of U251 and T98G cells were examined by wound healing assay (magnification 100×, scale bar = 100 µm). (c-d) The invasion abilities of U251 and T98G cells were evaluated by transwell assay after transfection (magnification 200×, scale bar = 50 µm). **P< 0.01 vs. MC group, ##P< 0.01 vs. IC group, ^^P< 0.01 vs. I group. All experiments were performed in triplicate and data were expressed as mean ± SD.
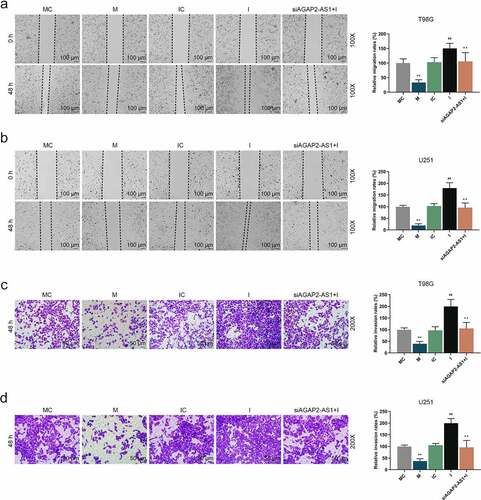
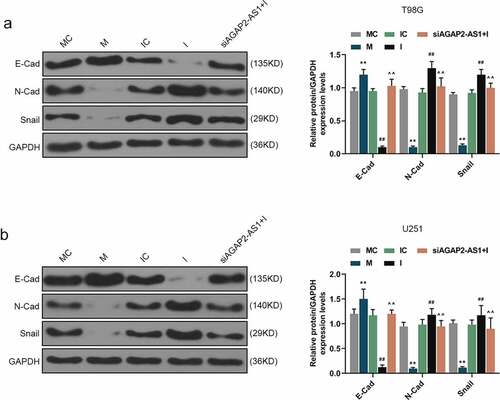
Figure 8. AGAP2-AS1 facilitated the expressions of EMT-related markers in glioma cells by targeting miR-497-5p. (a-b) The regulatory effects of AGAP2-AS1 and miR-497-5p on the EMT-related markers were determined by western blot after miR-497-5p M, miR-497-5p I or siAGAP2-AS1 was transfected into U251 and T98G cells. **P< 0.01 vs. MC group, ##P< 0.01 vs. IC group, ^^P< 0.01 vs. I group. All experiments were performed in triplicate and data were expressed as mean ± SD.